- AUD/JPY buyers trying to snap five-day losing streak above 76.00.
- Confluence of 21-day SMA and falling wedge resistance becomes the key.
- An eight-day-old falling trend line can offer immediate support.
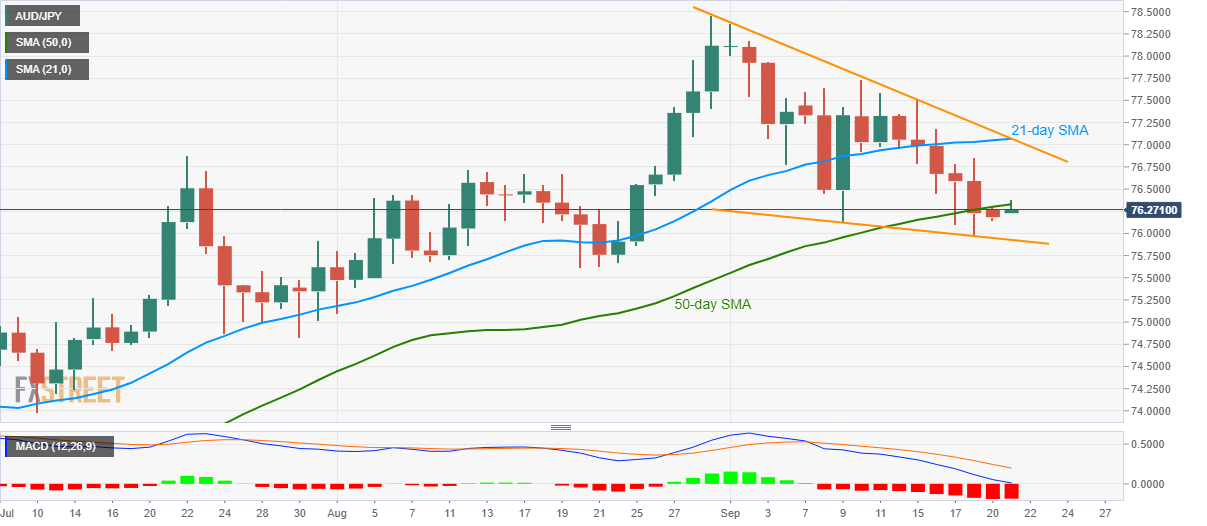
AUD/JPY stays on the recovery mode around 76.30 during the early Monday morning in Asia. In doing so, the pair buyers attack 50-day SMA inside the monthly falling wedge, a bullish chart pattern, on the daily formation.
Considering the bearish MACD signals and strong resistance, the quote is likely to remain depressed and may revisit 76.00 round-figures. Though, it’s further downside will be limited to the wedge’s support line, at 75.92 now.
In a case where AUD/JPY drops below 75.90, August 20 low near 75.60 and the previous month’s bottom surrounding 75.10 will be the key to watch.
Meanwhile, an upside clearance of the 50-day SMA level of 76.33 will aim for 76.90 whereas 21-day SMA and a falling trend line from August 31, currently around 77.06, will be the key to watch afterward.
It should, however, be noted that the quote’s daily closing beyond 77.06 will confirm the bullish chart play towards the theoretical target of 79.50. However, 77.70 and August month’s peak near 78.50 can offer intermediate halts during the rise.
AUD/JPY daily chart
Trend: Pullback expected
