- AUD/JPY near the October 2019 lows.
- Bearish MACD signals further declines, sellers await a clear break below the key support.
- January month low, 61.8% Fibonacci retracement limit near-term recovery moves.
AUD/JPY declines to 72.04, down 0.33%, by the press time of the early Tokyo session on Friday. While a sustained declines below 61.8% Fibonacci retracement of the pair’s August-December 2019 upside portrays the bears’ dominance, a horizontal area connecting late-August 2019 tops to October bottoms seem to challenge the sellers.
As a result, the pair’s pullback moves towards January month’s low of 72.44 can be expected. However, further upside is likely to be limited by 61.8% Fibonacci retracement level of 72.70.
In a case where AUD/JPY prices hold the recovery moves beyond 72.70 on a daily closing basis, 21-day SMA and 50% Fibonacci retracement, around 73.38/43, will be in focus.
Meanwhile, the pair’s additional fall below 71.70 could take aim at September 2019 bottom close to 71.10 whereas further downside might not refrain to recall 70.30 and 70.00 marks on the chart.
AUD/JPY daily chart
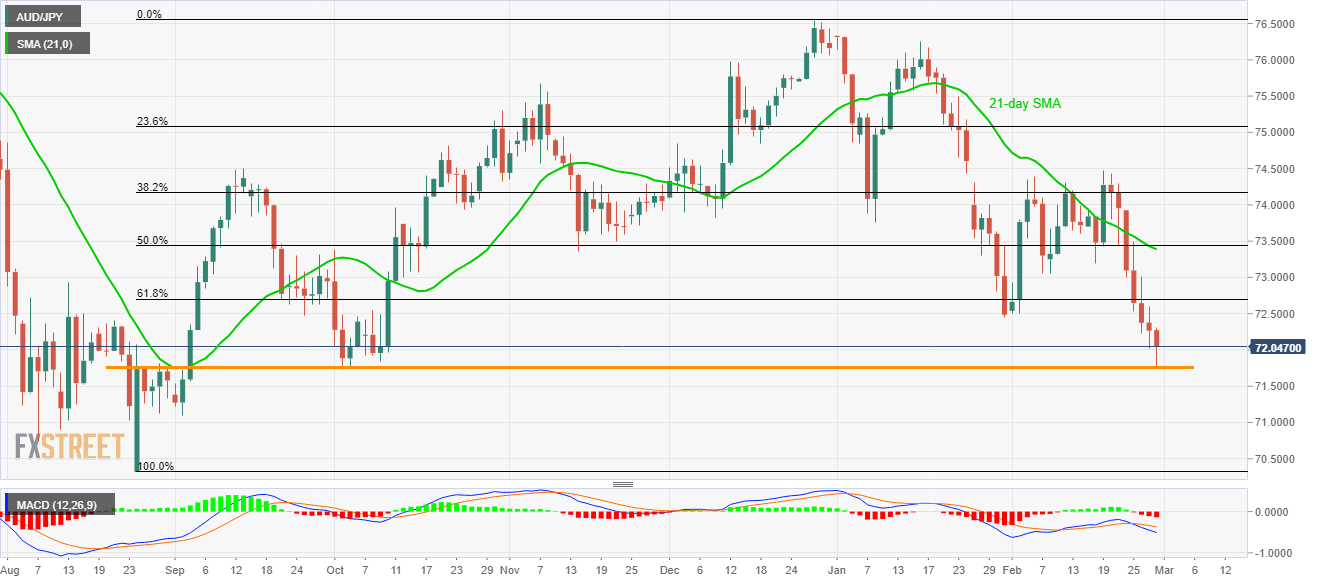
Trend: Pullback expected
