- AUD/JPY remains on the back foot near multi-month lows.
- 10-day SMA offers immediate resistance amid bearish MACD.
- Oversold RSI conditions challenge further selling below the short-term key support line.
AUD/JPY seesaws around 69.00, following the intra-day low of 68.82, amid the initial Asian session on Monday.
It should be noted that AUD/JPY is considered as the market’s risk barometer and registers declines during times of uncertainty/pessimism. The current fall seems to have taken its clues from the coronavirus (COVID-19) fatalities inside the key global economies.
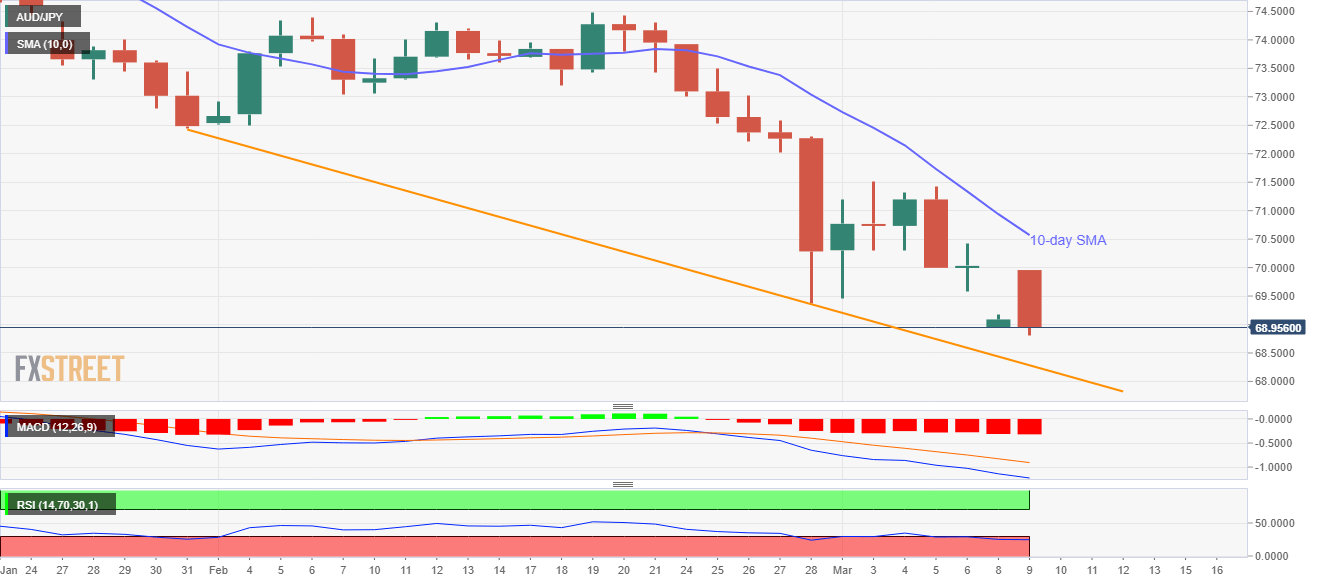
The pair’s sustained trading below 10-day SMA defies Friday’s Doji candlestick formation while signaling further downside.
In doing so, a descending trend line since January 31, 2020, at 68.28 now, grabs the bears’ attention.
However, the quote’s further declines are likely to be challenged by oversold RSI conditions, which if ignored could drag the quote to April 2009 low near 68.15.
Alternatively, a sustained break above 10-day SMA level of 70.57 can avail the monthly top near 71.52 as the next target ahead of confronting the January month low near 72.45.
AUD/JPY daily chart
Trend: Bearish
