- AUD/JPY remains on the back foot after breaking a one-week-old rising channel the previous day.
- 100-bar SMA, 50% Fibonacci retracement questions the pair’s immediate declines.
- A horizontal area comprising highs marked from March 12 can question buyers during the pullback.
AUD/JPY stays under pressure while trading around 65.90 amid the early Asian session on Wednesday. Even so, a confluence of 100-bar SMA and 50% Fibonacci retracement of its declines from March 03 seems to limit the pair’s immediate declines.
In addition to 65.70 support confluence, high marked on March 20 near 65.60 and 38.2% Fibonacci retracement near 64.30 also questions the bears.
However, bearish MACD and a sustained downside below short-term rising channel keep favoring the sellers.
Alternatively, buyers not only need to rise back above the said channel’s support, currently around 66.30, but should also clear 61.8% Fibonacci retracement level of 67.10 and the channel’s resistance line, near 67.80, to register strength in momentum.
In doing so, a horizontal area around 67.70, comprising highs marked since March 12, 2020, could offer an intermediate halt.
AUD/JPY four-hour chart
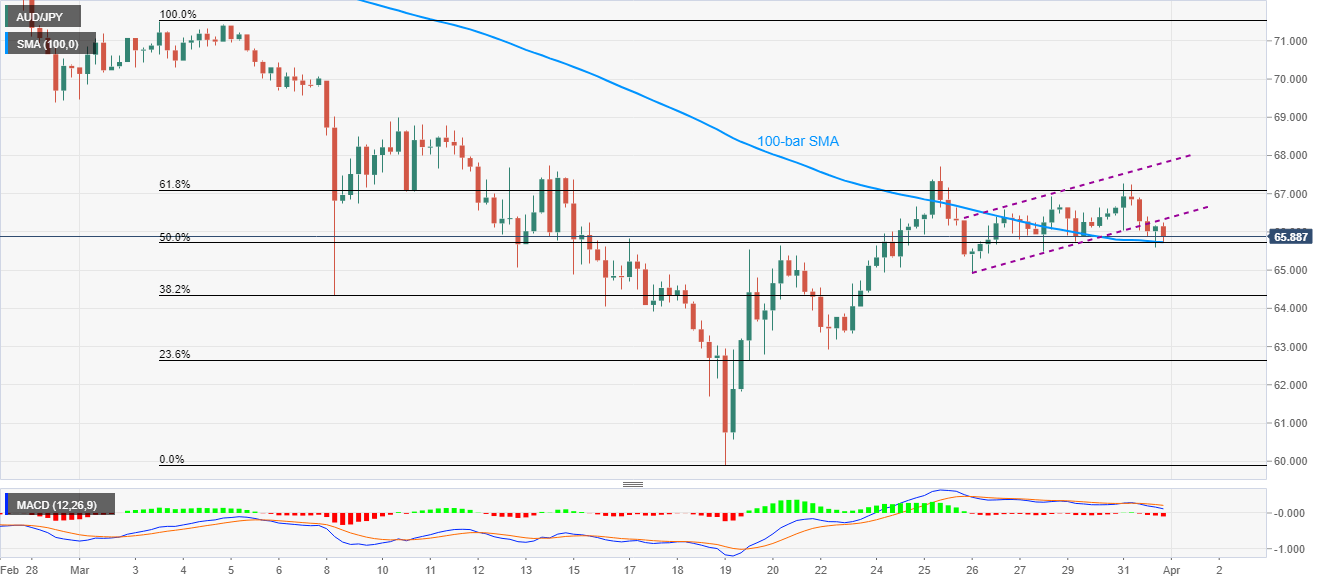
Trend: Bearish
