- AUD/JPY drops to the lowest since October 10, 2019.
- Bearish MACD supports the break of 61.8% Fibonacci retracement, 71.75/85 area in the spotlight.
- 100-day SMA joins the key Fibonacci retracements to challenge the buyers.
AUD/JPY trades near the lowest in more than a 16-week period while flashing 72.46 as the quote during the early Asian session on Monday. The pair recently broke 61.8% Fibonacci retracement of its run-up from August to December 2019 while bearish MACD signals also favor the pair’s further declines.
In doing so, an area including October 2019 low and highs marked during late-August, around 71.75/85 grab the bears’ attention.
During the pair’s further downside past-71.75, 71.00 and the year 2019 bottom close to 70.30 will be in the spotlight.
Alternatively, 61.8% and 50.00% Fibonacci retracements near 72.70 and 73.45 can limit the pair’s short-term recovery ahead of the 100-day SMA level of 74.30.
If at all prices manage to rise beyond 74.30, buyers targeting 75.00 should return to trading.
AUD/JPY daily chart
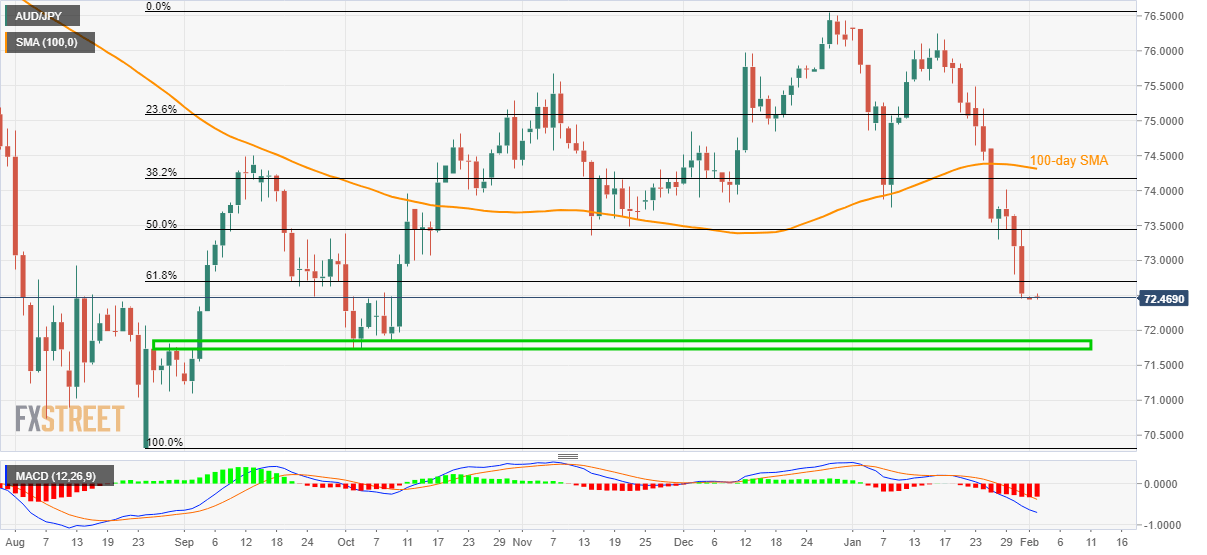
Trend: Bearish
