- AUD/JPY rolls on the late-Friday weakness from 73.64 amid broad risk-off mood.
- A two-week-old triangle restricts the pair’s immediate moves.
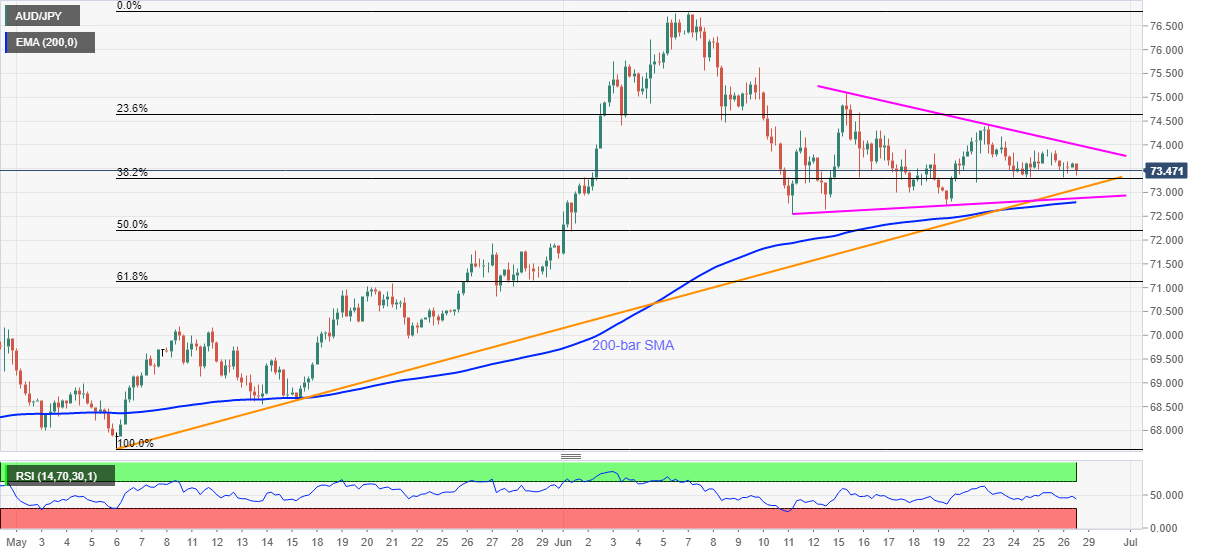
- An ascending trend line from May 06, 200-bar EMA act as additional downside filters.
AUD/JPY bounces off intraday low of 73.36 to 73.47 during the early Asian session on Monday. Though, the pair keeps the short-term symmetrical triangle formation intact despite the last week’s downbeat performance.
Even so, an upward sloping trend line from early-May, at 73.07 now, seems to lure the bears ahead of highlighting the triangle’s support line near 72.85. Also acting as the near-term key support is the 200-bar SMA near 72.80.
Hence, the sellers may await a clear break below 72.80 to aim for late-May top surrounding 71.90 whereas any more downside could push them towards 61.8% Fibonacci retracement of May-June upside, near 71.10.
Alternatively, the resistance line of the said triangle formation, currently near 74.00, becomes an immediate upside barrier to watch, a break of which could aim for 74.40 and the mid-month high 75.10.
In a case where the bulls remain dominant past-75.10, 75.70 and 76.25/30 might offer intermediate halts before challenging the monthly high around 76.80.
AUD/JPY four-hour chart
Trend: SIdeways
