- AUD/JPY funnels down the break-point of a two-week-old symmetrical triangle.
- Normal RSI conditions suggest continuation of sideways moves.
- Strong support on the downside favor bulls eyeing fresh monthly top.
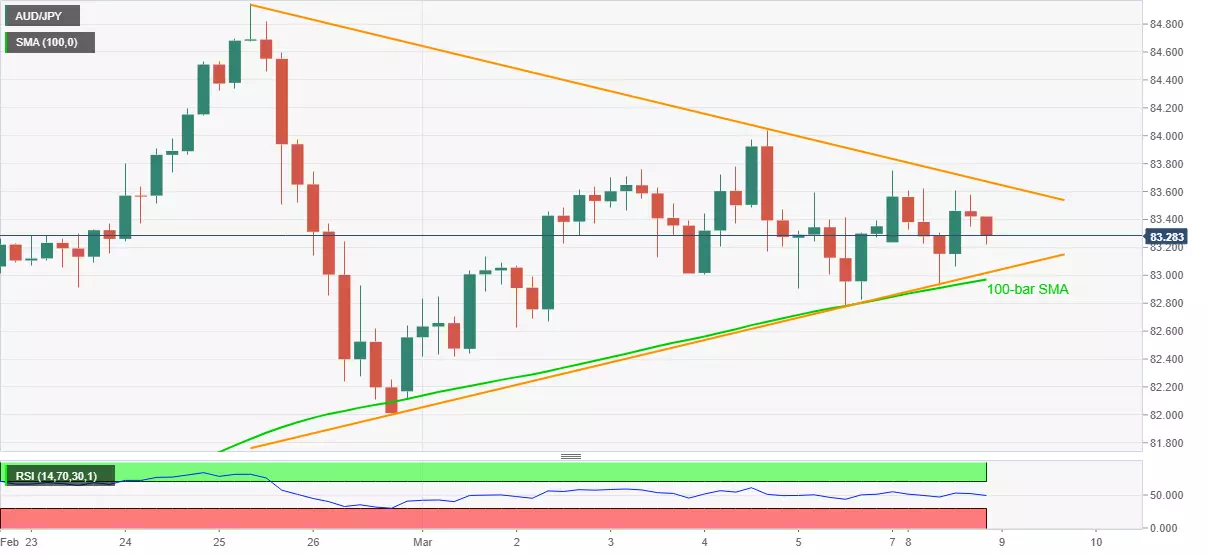
AUD/JPY wavers around 83.20-25, fades the recent pullback moves, amid the early Asian trading on Tuesday. In doing so, the quote remains stuck inside a symmetrical triangle formation established since February 25.
While normal RSI conditions indicate no change in the current trend, actually no trend, 100-bar SMA adds to the downside support and raises bars for the bears’ entry around 83.00-82.95.
As a result, an upside clearance of the stated triangle’s resistance line, currently around 83.70, will have higher confidence in testing the monthly top of 84.04.
Following that, the multi-month high flashed in February near 85.00 will be the key.
Alternatively, a downside break of 82.95 may not hesitate to recall the AUD/JPY sellers targeting the late February lows near 82.00.
AUD/JPY four-hour chart
Trend: Sideways
