- AUD/JPY marks 1.0% loss, fail to carry the earlier pullback moves from the multi-year low.
- The pair’s U-turn from the key Fibonacci retracement, bearish MACD favor sellers.
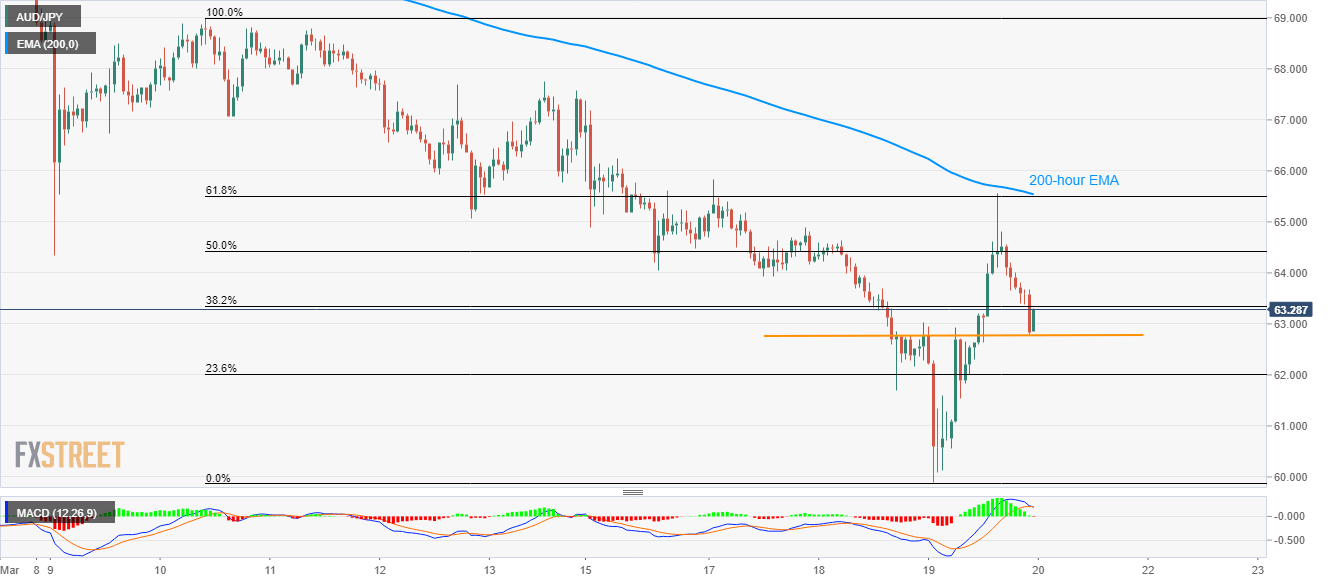
- 200-hour EMA adds to the resistance.
While extending its pullback moves from 61.8% Fibonacci retracement of March10-19 declines, AUD/JPY drops to 63.00, down 1.0%, by the press time of Friday’s Asian session. Also favoring the sellers is the MACD histogram that is teasing bears.
That said, a horizontal line around 62.80 is likely immediate support for the pair ahead of its further downside towards 23.6% Fibonacci retracement level around 62.00.
During the pair’s further weakness past-62.00, the recently flashed multi-year low of 59.90 will gain the bears’ attention.
On the upside, 64.00 can act as the nearby resistance, a break of which could propel the quote to the confluence of 61.8% Fibonacci retracement and 200-hour EMA, around 65.50/55.
In a case where the bulls manage to cross 65.55, 67.00 could become their favorite.
AUD/JPY hourly chart
Trend: Bearish
