- AUD/JPY sellers catch a breath after breaking key supports (now resistances).
- 50% Fibonacci retracement, 73.00 can act as nearby supports.
- November 2019 top will challenge buyers beyond 23.6% Fibonacci retracement.
AUD/JPY stays under pressure, mostly quiet off-late, while taking rounds to 73.62 during early Tuesday morning in Asia. The pair slipped to the monthly low after breaking 100-day SMA and an upward sloping trend line since September 02 the previous day.
With this, sellers now take aim at 50% Fibonacci retracement of its August-December 2019 upside, at 73.44, as immediate support. However, multiple stops around 73.00, marked since late-September, could question the pair’s further declines.
In a case where AUD/JPY prices remain weak below 73.00, 61.8% Fibonacci retracement and October 2019 low can please the bears around 72.70 and 71.74 respectively.
Meanwhile, an upside clearance of the confluence of support-turned-resistance and 38.2% Fibonacci retracement, surrounding 71.18/20, will confront a 100-day SMA level of 71.40.
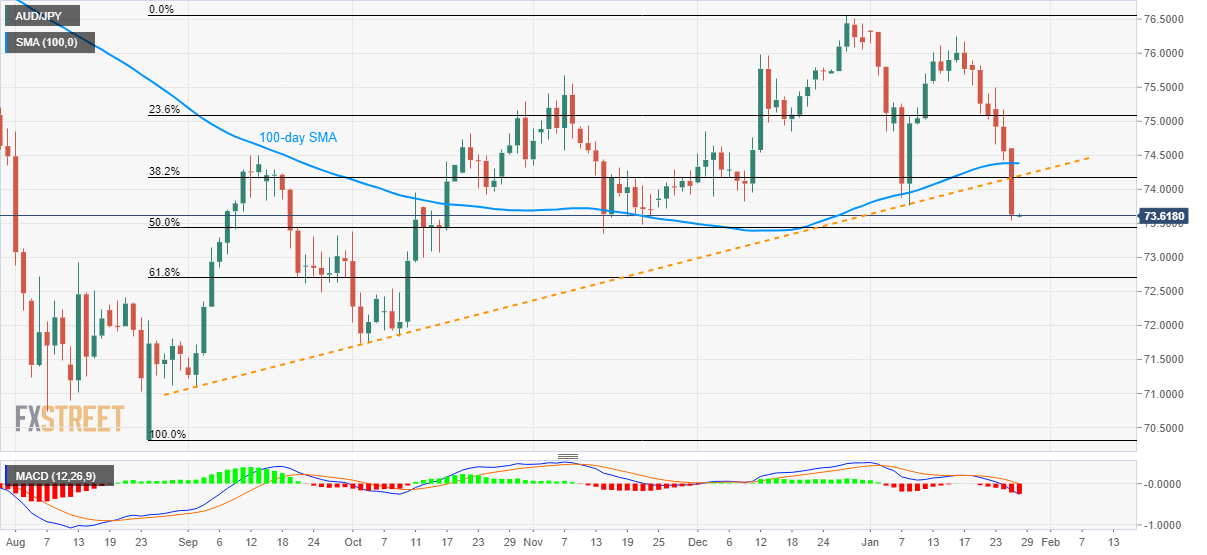
During the pair’s additional rise past-71.40, 23.6% Fibonacci retracement near 75.10 and November 2019 top close to 75.70 will be the bull’s favorites.
AUD/JPY daily chart
Trend: Bearish
