- AUD/JPY seesaws in a 20-pip range.
- A daily close beyond 21-day SMA, bullish MACD favor buyers.
- Sellers will seek entries below Thursday’s low.
Despite trading in a range between 66.35 and 66.55 since Monday’s US session, currently around 66.30, AUD/JPY remains mildly on the back foot, down 0.10%, amid the early Tuesday morning in Asia.
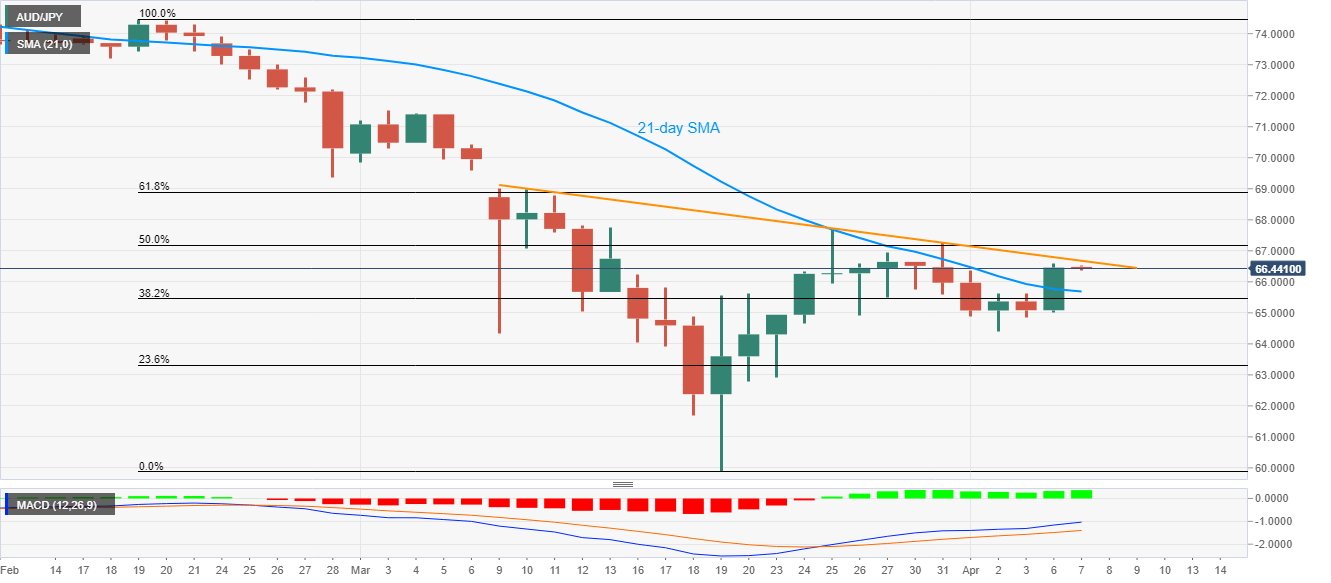
While the pair’s first daily closing beyond 21-day SMA since early-February, coupled with the bullish MACD, keep buyers hopeful, a downward sloping trend line from March 10 seems to be an immediate challenge.
On the break of 66.70 resistance line, 67.00 and March 25 high near 67.70 will be on the bull’s radar.
Further, 61.8% Fibonacci retracement of February-March declines, near 68.90, could lure the buyers beyond 67.70.
Meanwhile, a daily break below the 21-day SMA level of 65.70 might push sellers to await further downside under Thursday’s low of 64.40 to target 23.6% Fibonacci retracement level of 63.30.
AUD/JPY daily chart
Trend: Further recovery expected
