- AUD/JPY trims losses from 76.55 inside a bullish chart pattern.
- Sustained trading beyond the key SMAs keeps buyers hopeful.
- Bearish MACD signals push optimists towards being cautious.
AUD/JPY pick-up bids near 76.35 during the early Wednesday morning in Asia. The recovery moves follow the quote’s slump from 76.55 to 76.11 while also portraying the bullish flag formation on the four-hour chart to suggest the further upside. However, MACD conditions warrant the bulls to wait for a trigger before expanding the position sizes.
In doing so, the pair’s upside break of the said flag, near 76.60 now, becomes necessary to overcome the strong resistance near 77.00 round-figures.
Should the bulls remain dominant past-77.00, February 2019 low near 77.45 and March 2019 bottom close to 77.55 will be in the spotlight.
On the contrary, a descending trend line from August 12, forming the part of the said bullish pattern close to 76.10, restricts the pair’s immediate downside.
If at all bearish MACD drag AUD/JPY prices below 76.10, 100-bar and 200-bar SMAs, respectively around 75.90 and 75.50, could defend the bulls afterward.
AUD/JPY four-hour chart
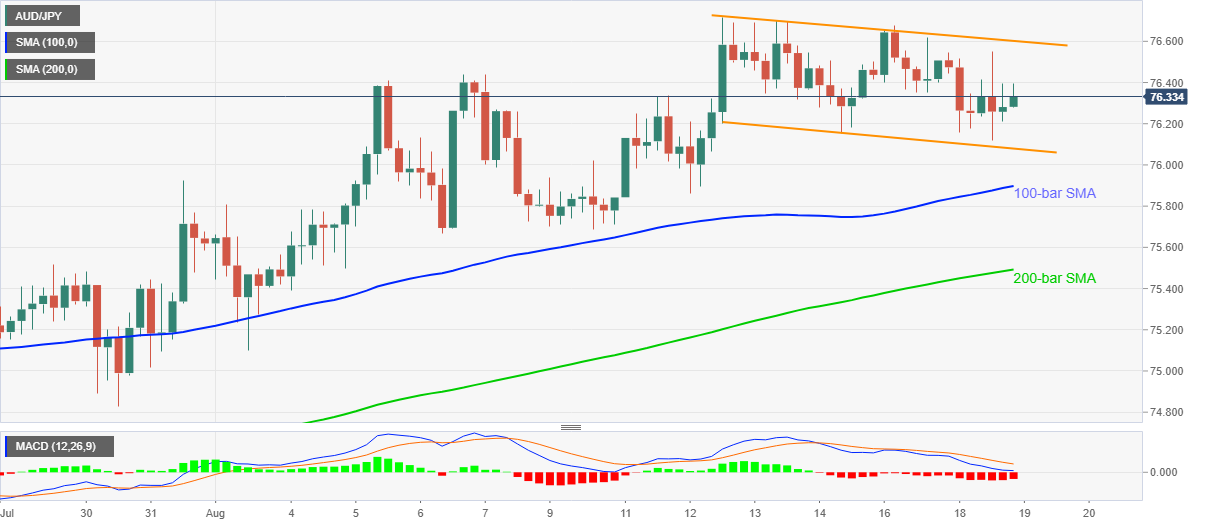
Trend: Bullish
