- AUD/JPY picks up the bids inside the bullish pattern.
- 200-HMA offers strong support, 75.50 adds to the upside barriers.
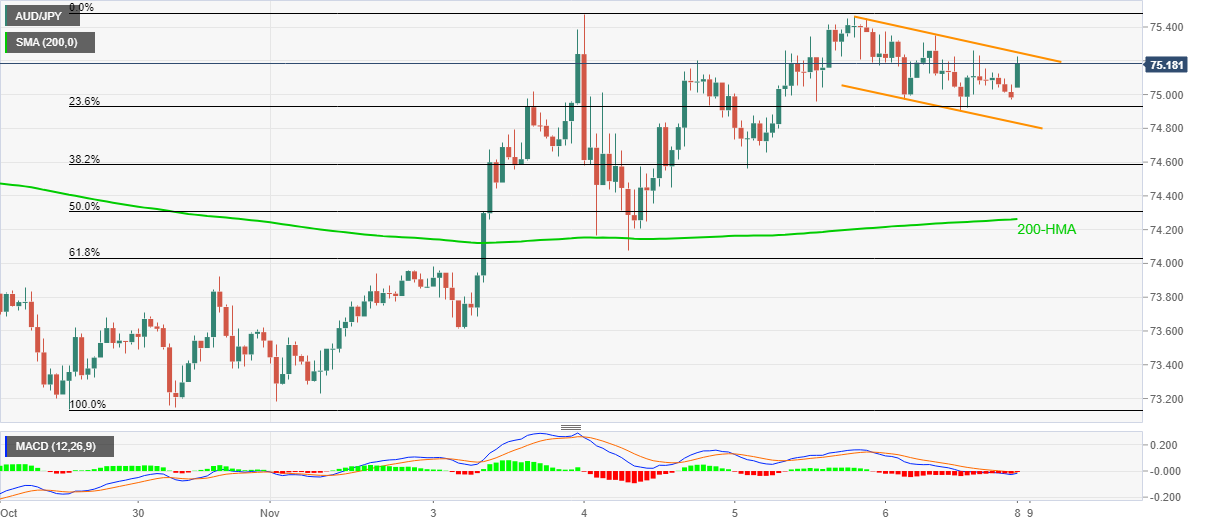
AUD/JPY rises to 75.17, up 0.25% intraday, during the initial hour of Monday’s Asian trading. In doing so, the pair takes the bids inside the bullish flag on the hourly chart.
While sustained trading beyond 200-HMA and a bullish formation keep the AUD/JPY buyers hopeful, a clear break of 75.25 will have to cross the last week’s top near 75.50 to convince the bulls.
Following that, the 76.00 may offer an intermediate halt before fueling the quote towards the previous month’s peak surrounding 76.50.
Meanwhile, the support line of an immediate channel, part of the flag, currently around 74.80, restricts the quote’s short-term downside ahead of the 200-HMA level near 74.25.
In a case where the bears dominate below 74.25, the last Monday’s top close to the 74.00 round-figure and 73.60 can entertain intraday sellers ahead of directing them to the monthly low near 73.20.
AUD/JPY hourly chart
Trend: Bullish
