- AUD/JPY recovers from 73.32, snaps two-day losing streak.
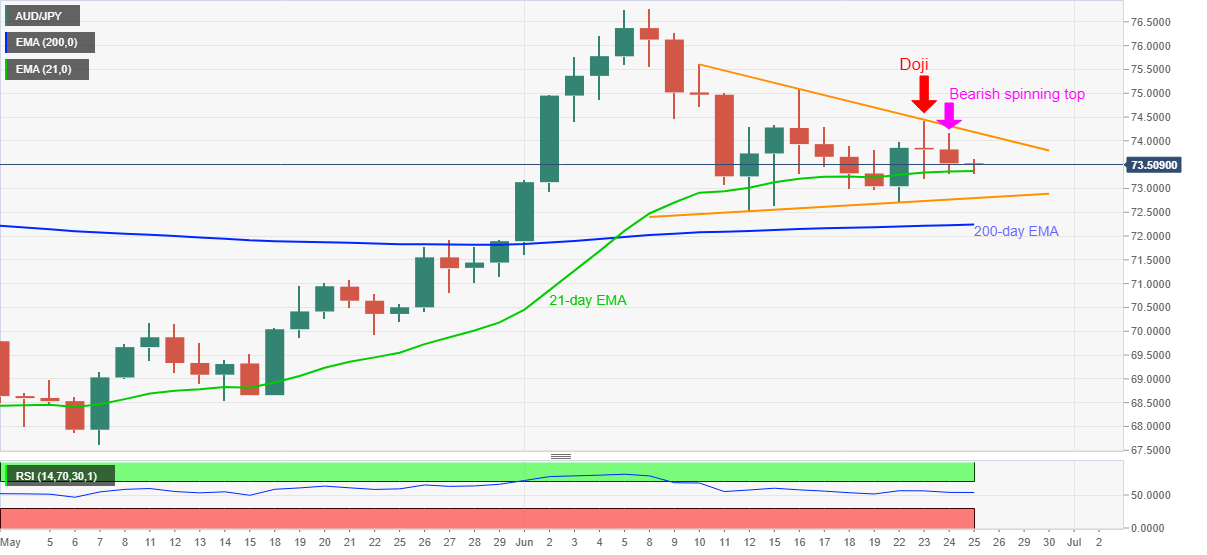
- Bearish spinning top, following Doji, portrays the pair’s weakness.
- A short-term symmetrical triangle limits the moves above 200-day EMA.
AUD/JPY keeps the pullback moves from 73.32 while taking rounds to 73.56, up 0.07% on a day, amid Thursday’s Asian session. The pair defies the previous two-day declines while taking a U-turn from 21-day EMA. Though, the recent candlestick formations on the daily chart limit the bulls’ entry inside a two-week-old triangle formation beyond 200-day EMA.
Although the latest upside from 21-day EMA is likely to probe the said triangle’s resistance, at 74.18 now, Doji followed by the spinning top suggests the traders’ indecision and favors the sellers.
Hence, buyers are likely to wait for a clear break above Tuesday’s high of 74.42 before entering any trades. In doing so, 75.10 and 75.62 might become their immediate targets ahead of the monthly top of 76.79.
On the contrary, a downside break below 21-day EMA level of 73.37 could take rest on the triangle’s lower line, currently around 72.80, a break of which will push the sellers towards 200-day EMA, at 72.24 now.
It should additionally be noted that the pair’s declines past-72.24 might look for validation from May 27 high of 71.93 before aiming 70.00 threshold.
AUD/JPY daily chart
Trend: Bearish
