- AUD/JPY breaks the monthly support trend line, still trades above 100-bar SMA.
- February 09 low could lure sellers during the sustained downside.
- An eight-day-old falling trend line restricts immediate upside.
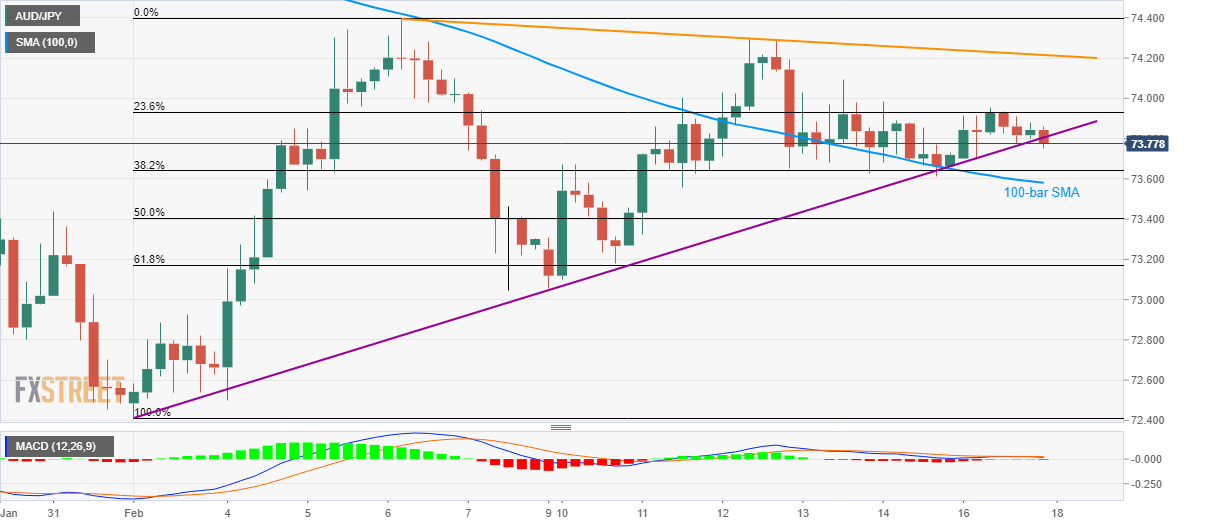
AUD/JPY drops to 73.75 amid the initial Asian session on Tuesday. The pair recently slipped below an ascending trend line stretched from February 02. Even so, sellers await a clear break under 100-bar SMA to confirm the pair’s weakness.
In doing so, 50% Fibonacci retracement of the early-month upside, around 73.40, can act as an intermediate halt to the quote’s drop towards February 09 low nearing 73.00.
If bears refrain to respect 73.00 mark, 72.80 and the monthly bottom surrounding 72.40 will return to the charts.
Alternatively, 23.6% Fibonacci retracement near 73.93 acts as an immediate upside barrier ahead of the short-term falling trend line, at 74.20 now.
If AUD/JPY prices manage to stay strong beyond 74.20, 74.40 becomes the key as it comprises the monthly top and 100-day SMA on the daily chart.
AUD/JPY four-hour chart
Trend: Sideways
