- AUD/JPY fails to extend bounce off 50% Fibonacci retracement even as MACD turns bullish.
- Three-week-old falling trend line adds to the upside filters, monthly low raise bars for bears’ entry.
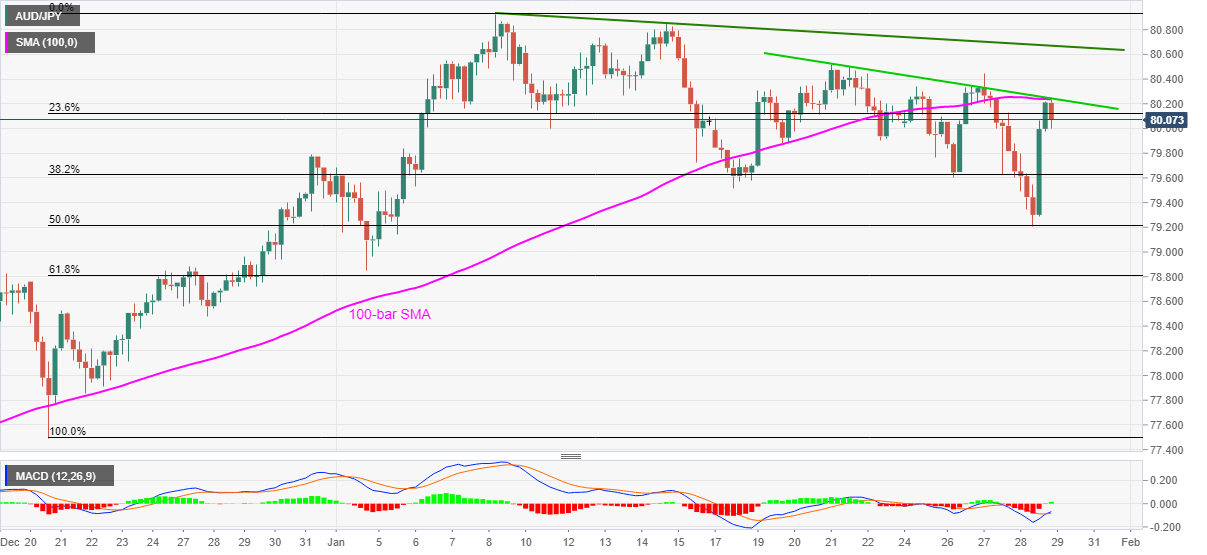
AUD/JPY fades recovery moves from 79.20 while easing to 80.00 during early Asian trading session on Friday. In doing so, the quote takes a U-turn from a confluence of 100-bar SMA and a downward sloping trend line from January 21.
It should, however, be noted that the bullish MACD signals and the quote’s ability to recover from 50% Fibonacci retracement of late December 2020 to the early January 2021 upside increase the odds of further upside.
Hence, AUD/JPY bulls seem to wait for a clear upside break of 80.25 resistance confluence to attack another key upside hurdle, namely a three-week-old resistance line, at 80.70 now.
Also acting as a challenge to the AUD/JPY buyers is the monthly peak, also the highest since December 2018, around 80.95.
Meanwhile, pullback moves can target 38.2% and 50% Fibonacci retracement levels, respectively around 79.60 and 79.20, before challenging the monthly low of 78.85.
Though, AUD/JPY weakness below 78.85 will be probed by the 61.8% Fibonacci retracement level of 78.80, if not then 78.50 and 77.85 are likely to lure the sellers.
AUD/JPY four-hour chart
Trend: Pullback expected
