- AUD/JPY remains on the back foot between 10-day SMA, short-term rising trend-line.
- Bearish MACD, failure to cross immediate SMA favor sellers.
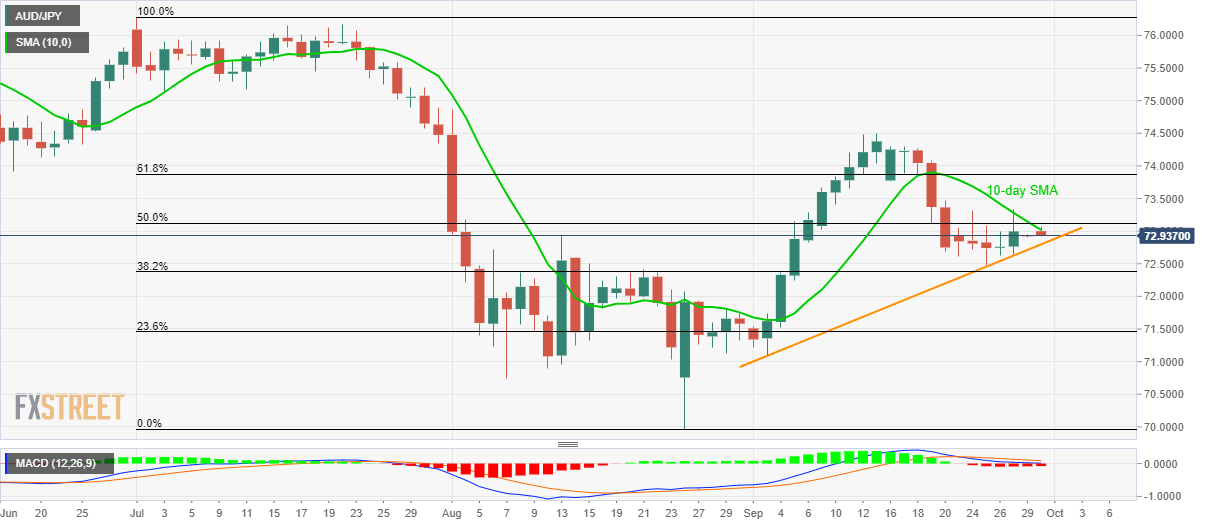
The AUD/JPY pair’s another failure to cross 10-day simple moving average (SMA) pleases sellers as the quote declines to 72.94 during early Monday morning in Asia.
Not only repeated pullbacks from short-term SMA but the bearish signal from 12-bar moving average convergence and divergence (MACD) indicator also increases the importance of an upward sloping trend-line since September 03 at 72.80 now.
In a case prices decline below 72.80, last week’s low near 72.48 and 38.2% Fibonacci retracement level of July-August downpour, at 72.38, could entertain bears ahead of pushing them to aim for 72.00 support.
On the upside clearance of 10-day SMA, at 73.02 now, 73.40 and 61.8% Fibonacci retracement level of 73.87 should gain buyers’ attention.
Though, pair’s successful run-up beyond key Fibonacci retracement might not refrain from questioning monthly top surrounding 74.50.
AUD/JPY daily chart
Trend: pullback expected
