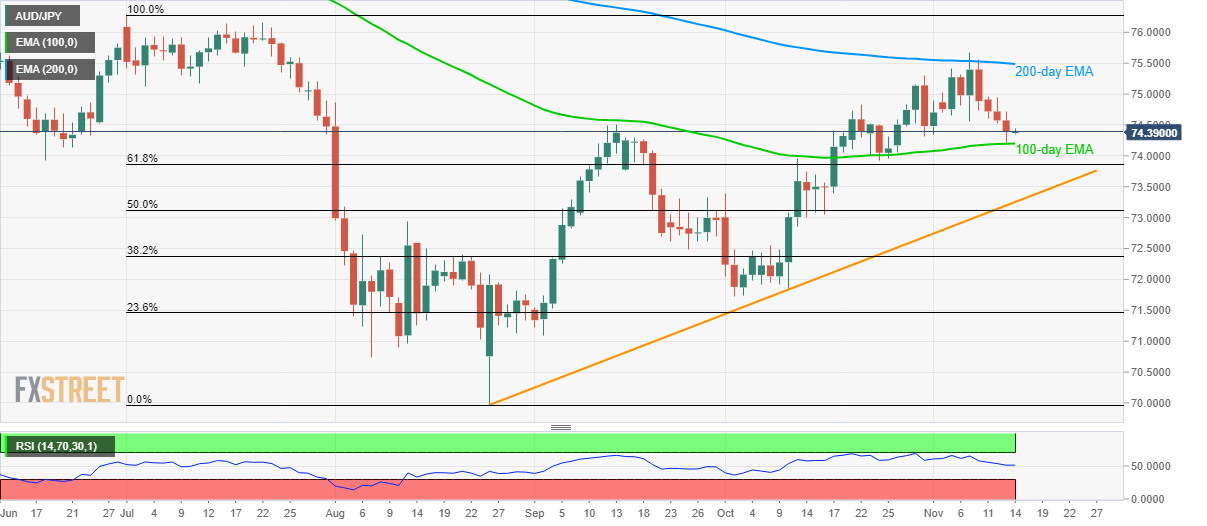
- AUD/JPY recently bounces off 100-day EMA.
- RSI returning to normal conditions signal pullback from the key supports.
- 200-day EMA acts as the strong upside resistance.
With the RSI returning to normal conditions, AUD/JPY bounces off 100-day EMA while trading around 74.40 during the initial Thursday morning in Asia.
The prices have been on the downward trajectory since the last four-day. The beginning was initially triggered by overbought conditions of 14-day Relative Strength Index (RSI) and 200-day Exponential Moving Average (EMA).
While buyers can take aim at 75.00 and 75.30, considering the recent U-turn and RSI levels, further upside will be capped by a 200-day EMA level of 75.50.
On the downside, pair’s declines below 100-day EMA level of 74.20 needs to slip below 61.8% Fibonacci retracement level of July-August declines, at 73.87, to target an upward sloping trend line since August 26, at 73.25 now.
In a case where prices decline below 73.25, the return of sub-72.00 area can’t be denied.
AUD/JPY daily chart
Trend: Pullback expected
