- AUD/JPY struggles to extend the latest pullback from the monthly support line.
- 100-day EMA holds the key to 23.6% Fibonacci retracement and month’s high.
- November low can please sellers after the support line breaks.
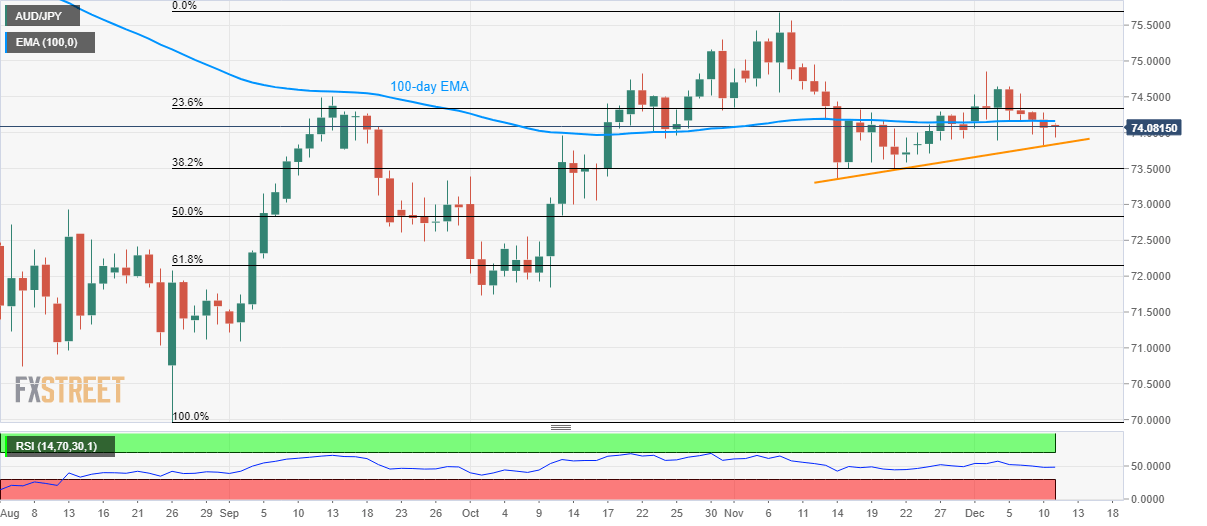
AUD/JPY trades near 74.10 during the Asian session on Wednesday. The pair recently bounced off a monthly support trend line but falls short of clearing 100-day Exponential Moving Average (EMA).
That said, sellers look for entry below the immediate support line, around 73.80 now, while targeting the return of November month low, the 73.35 level.
However, pair’s further declines can be confined by 50% Fibonacci retracement of August-November upside, at 72.83.
On the contrary, pair’s daily closing beyond 100-day EMA level of 74.16 becomes necessary to challenge 23.6% Fibonacci retracement, at 74.34, followed by the monthly top of 74.85.
It should also be noted that pair’s run-up beyond 74.85 enables the Bulls to aim for the previous month high close to 75.70.
AUD/JPY daily chart
Trend: Sideways
