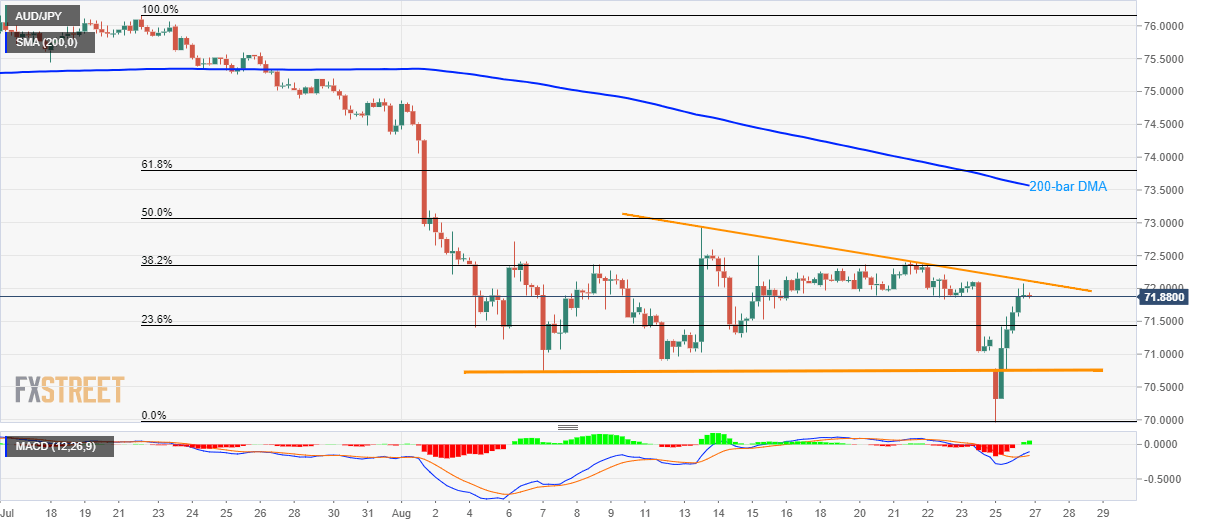
- AUD/JPY remains below short-term trend-line resistance despite bullish MACD.
- 200-bar DMA can please buyers on the upside break while 70.78/74 becomes immediate key support area.
Although recovery from multi-year low, coupled with bullish MACD, portrays the strength of buying momentum, failure to cross immediate resistance-line speaks for the sellers as the AUD/JPY pair trades around 71.90 during Tuesday morning in Asia.
The bullish signal of 12-bar moving average convergence and divergence (MACD) increases the odds for the pair’s run-up towards 200-bar simple moving average (DMA) level of 73.57. However, pair’s sustained break of the two-week-old descending trend-line, at 72.12, followed by a rise above 50% Fibonacci retracement level of July-August downpour close to 73.07, becomes necessary to please the buyers.
During the pair’s trading below 72.12 resistance-line, 23.6% Fibonacci retracement level of 71.44 and a horizontal area around 70.78/74, including August 07 low and yesterday’s extreme levels, can act as nearby support.
Should prices keep declining below 70.74, Monday’s low around 70.00 becomes the key to watch as a break of which could extend the declines towards March 2009 high near 69.60 and then to April 2009 bottom surrounding 66.80.
AUD/JPY 4-hour chart
Trend: Bearish

