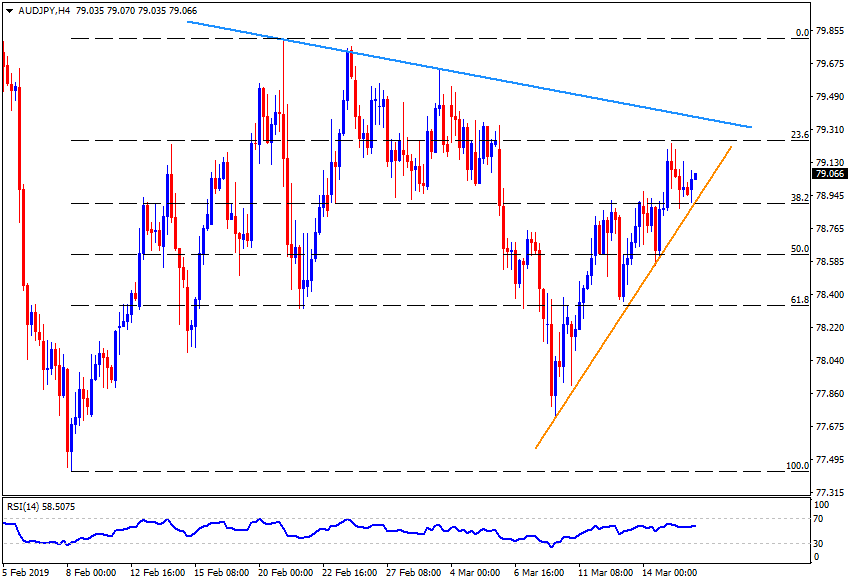
- AUD/JPY took a U-turn from two-week-old ascending trendline as it trades near 79.10 during early Monday.
- 23.6% Fibonacci retracement of February 08 to 21 upside, at 79.30 acts as immediate resistance for the pair, a break of which can propel it to a descending resistance-line stretched since February 21 around 79.45.
- Assuming buyers’ ability to conquer 79.45, 79.60, 79.85 and 80.00 could flash in their radar.
- Meanwhile, a downside break of 78.90 support-line figure might drag the quote to 78.50, 78.30 and 78.00 consecutive supports.
- Additional downside under 78.00 can avail 77.70 and 77.40 as rest points.
AUD/JPY 4-Hour chart
Additional important levels:
Overview:
Today Last Price: 79.05
Today Daily change: 8 pips
Today Daily change %: 0.10%
Today Daily Open: 78.97
Trends:
Daily SMA20: 78.97
Daily SMA50: 78.62
Daily SMA100: 79.7
Daily SMA200: 80.53
Levels:
Previous Daily High: 79.25
Previous Daily Low: 78.85
Previous Weekly High: 79.25
Previous Weekly Low: 77.91
Previous Monthly High: 79.85
Previous Monthly Low: 77.44
Daily Fibonacci 38.2%: 79.1
Daily Fibonacci 61.8%: 79
Daily Pivot Point S1: 78.8
Daily Pivot Point S2: 78.62
Daily Pivot Point S3: 78.4
Daily Pivot Point R1: 79.2
Daily Pivot Point R2: 79.42
Daily Pivot Point R3: 79.6
