- AUD/JPY pulls back from the week’s high.
- 50% Fibonacci retracement, 200-bar SMA gain sellers’ attention.
- An upside break of the monthly resistance line could recall early-November tops.
AUD/JPY declines to 74.62 by the press time of early Asian session on Thursday. The pair takes a U-turn from the highest since December 03. In doing so, it refrains to visit 61.8% Fibonacci retracement of November month fall and a descending resistance line since November 10.
With this, sellers can aim for 50% Fibonacci retracement and 200-bar Simple Moving Average (SMA), near 74.50 and 74.35 respectively, as immediate targets.
However, pairs’ further declines will be limited by the weekly low near 73.80.
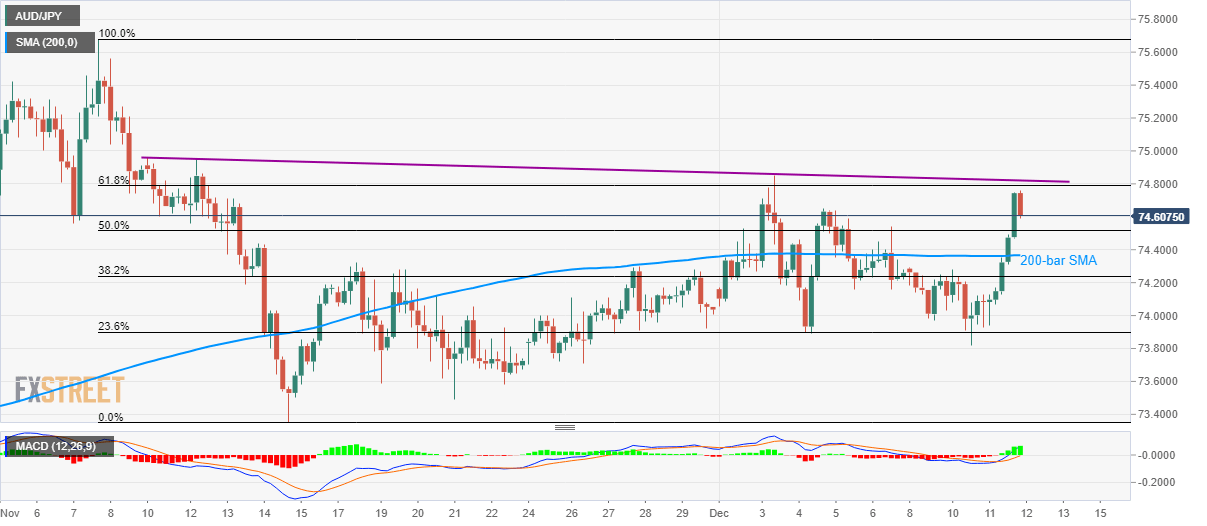
Meanwhile, sustained trading beyond 61.8% Fibonacci retracement and monthly resistance line, around 74.80/82, can escalate the latest rise towards 75.30 and November month high near 75.70.
AUD/JPY four-hour chart
Trend: Pullback expected
