- AUD/JPY takes the bids around August-start top.
- Buyers await a break of descending trend-line stretched since mid-April to aim for 100-day EMA.
- A pullback can have 50-day EMA as immediate support.
Despite successfully clearing 50-day exponential moving average (EMA) for the first time since late-April, AUD/JPY stays below key resistance-line as it trades near 73.60 during early Tuesday morning in Asia.
The pair needs to clear a downward-sloping trend-line since April 17, at 73.85 in order to aim for 100-day EMA level of 74.60. However, 38.2% Fibonacci retracement level of April-August downpour, at 74.08, could act as an intermediate resistance.
In a case prices witness pullback from current levels, 73.26 comprising 50-day EMA becomes adjacent support to watch ahead of observing 74.60/62 support-confluence including 23.6% Fibonacci retracement and 21-day EMA.
During the pair’s downside under 74.60, August-end tops surrounding 71.80 and 71.00 could lure sellers.
AUD/JPY daily chart
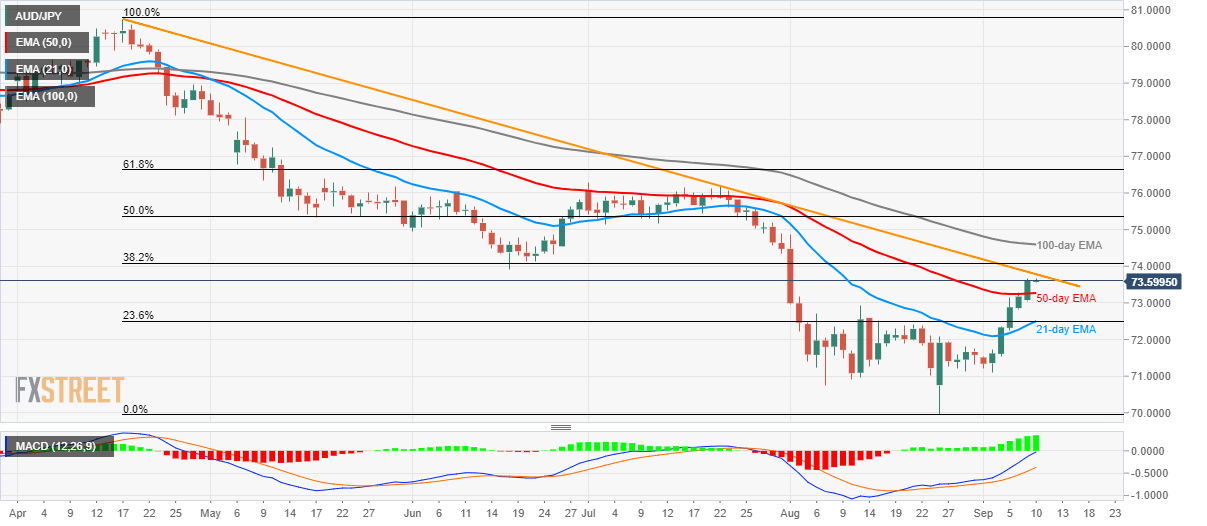
Trend: pullback expected
