AUD/JPY struggles around the two-week low of 79.30 during early Wednesday.
Failure to cross 80.65/70 horizontal-area including lows marked during December 10 and 12 of 2018 seems gradually dragged the pair downward off-late.
However, the presence of multiple important supports can trigger the pair’s pullback moves.
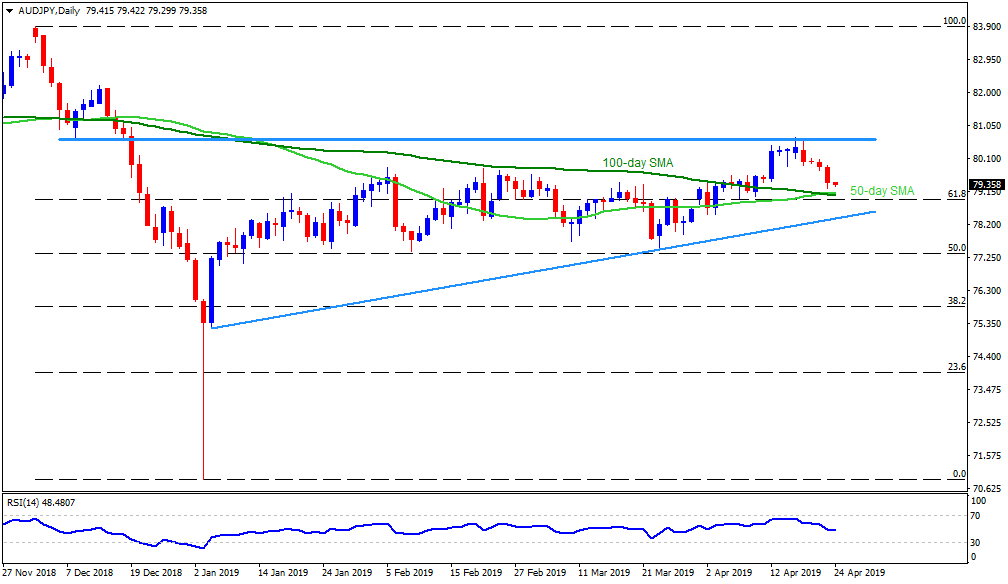
Presently, 50-day and 100-day simple moving average (SMA) confluence region around 79.15 – 79.05 could challenge sellers, a break of which highlights the importance of 61.8% Fibonacci retracement of December – January downturn near 78.90.
In a case prices keep trading southward after 78.90, an upward sloping support-line from January 04 at 78.30 seems crucial as it holds the quote’s dip to 77.85 and 77.50.
Meanwhile, 79.65, 80.00 and 80.40/45 might entertain short-term buyers during the pair’s pullback prior to questioning them with 80.65/70 resistance.
Assuming the Bulls’ capacity to clear 80.70 on a daily closing basis, 81.50 and 82.20 are likely following numbers to appear on the chart.
AUD/JPY daily chart
Trend: Pullback expected
