- AUD/JPY’s 8-hour chart is reporting a bear flag.
- A flag breakdown, if confirmed, would create room for a deeper drop to levels below 76.00.
AUD/JPY is currently trading at 78.62, representing a 0.10% gain on the day, having hit a low of 78.42.
The JPY cross topped out 80.72 on April 17 and fell to 78.10 on April 25, invalidating the channel breakout seen on April 12. Further, the pair seems to have created a bear flag pattern, a bearish continuation pattern, on the 8-hour chart.
A move below 78.31 would confirm a flag breakdown and open the doors to 75.69 (target as per the measured move method). On the way lower, the pair may encounter support at 77.54 (March 25 low) and 77.44 (Feb. 8 low).
The breakdown, however, may remain elusive if the risky assets remain on the offensive, pushing the anti-risk JPY lower. As of writing, the futures on the S&P 500 index are reporting a 0.30 percent gain.
8-hour chart
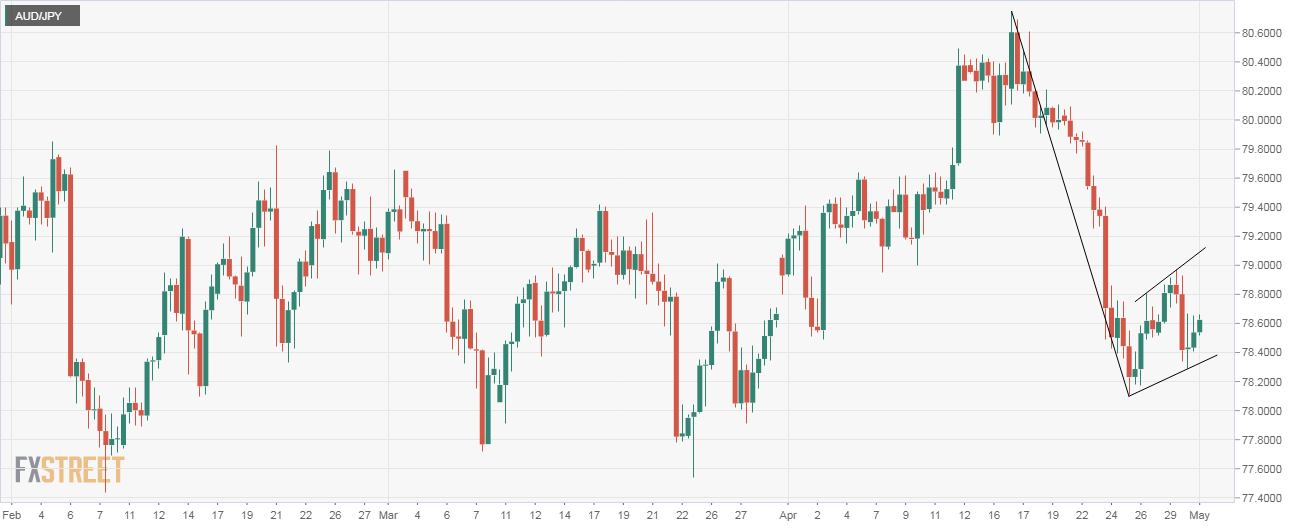
Trend: Bearish below 78.31
Pivot points
