- AUD/JPY takes a U-turn from seven-month-old support-line with RSI conditions being oversold.
- 23.6% Fibonacci retracement and June low can reappear during the extended pullback.
- The year 2016 bottom may stop bears targeting January lows in a case of further decline.
Despite trading at the lowest levels in seven-month, the AUD/JPY pair pulls back from medium-term support-line at it trades near 73.10 during the early Asian session on Friday.
Not only a downward-sloping trend-line since January 10 but the oversold condition of 14-day relative strength index (RSI) also signals brighter chances of the quote’s recovery.
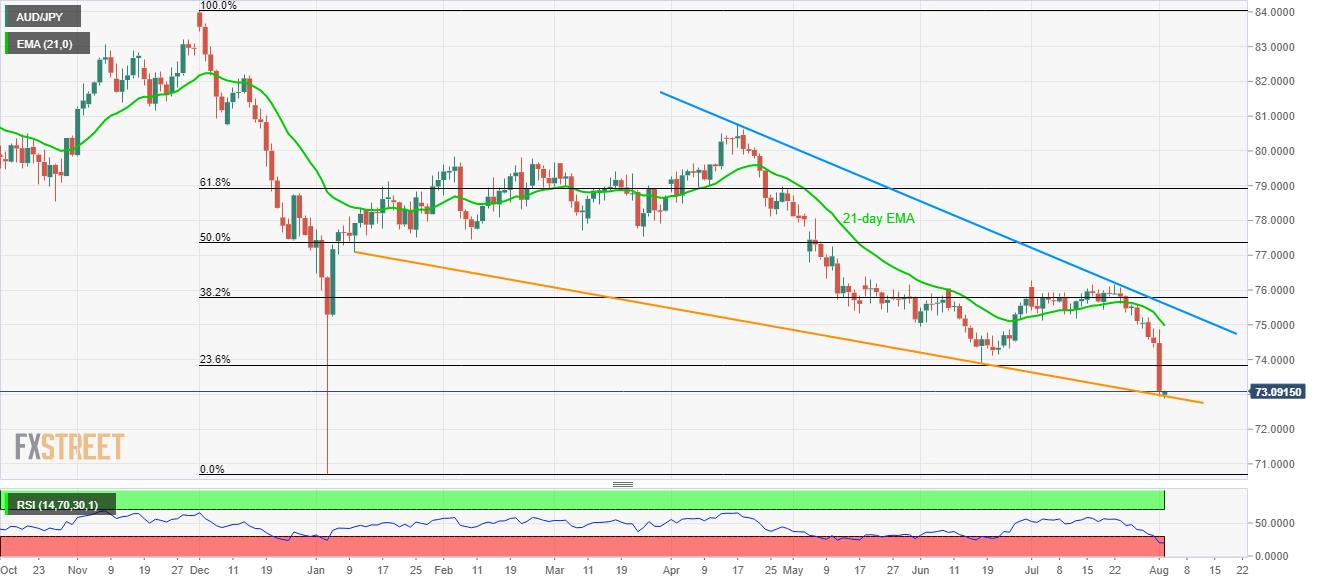
In doing so, 23.6% Fibonacci retracement of December 2018 to January 2019 downpour, at 73.83, becomes the first resistance to watch, followed by June month low of 73.92, June 19 high near 74.78 and 21-day exponential moving average (EMA) level of 74.98.
Should prices refrain from respecting the support-line and RSI by declining further below the recent low of 72.89, June 2016 bottom surrounding 72.40 and current year low of 70.71 will be in the spotlight.
AUD/JPY daily chart
Trend: Pullback expected
