- Sustained trading beyond 50/200-HMA, gradual RSI increase to support the AUD/JPY pair’s recovery.
- 4-day long horizontal resistance questions immediate upside.
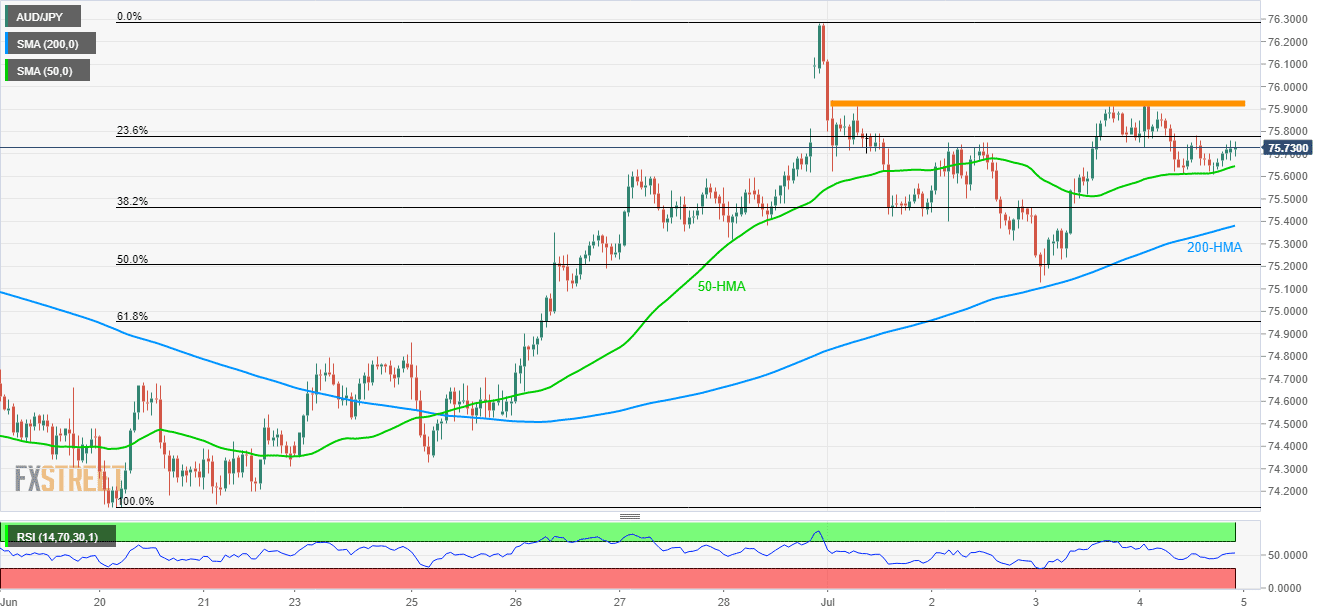
AUD/JPY remains firm above 50-hour moving average (HMA) as it takes the rounds to 75.75 during the early Asian session on Friday.
The 23.6% Fibonacci retracement of its late-June upside at 77.78 acts as immediate resistance for the pair ahead of fueling it to 75.91/94 resistance-area comprising multiple highs marked since Monday.
Should the pair manages to cross 75.94, its rally to early-month top surrounding 76.28 can’t be denied.
On the downside break of 75.65 including 50-HMA highlights the importance of 200-HMA, at 75.38 now.
In a case prices slip beneath 75.38, 75.13 and 61.8% Fibonacci retracement near 74.95 may lure sellers.
14-bar relative strength index (RSI) is slowly grinding upwards and portrays increased momentum support to the moves.
AUD/JPY hourly chart
Trend: Bullish
