- AUD/JPY stays above 23.6% Fibonacci retracement while falling behind 10-day EMA.
- Bullish MACD pushes buyers to aim for 72.85/87 resistance-confluence.
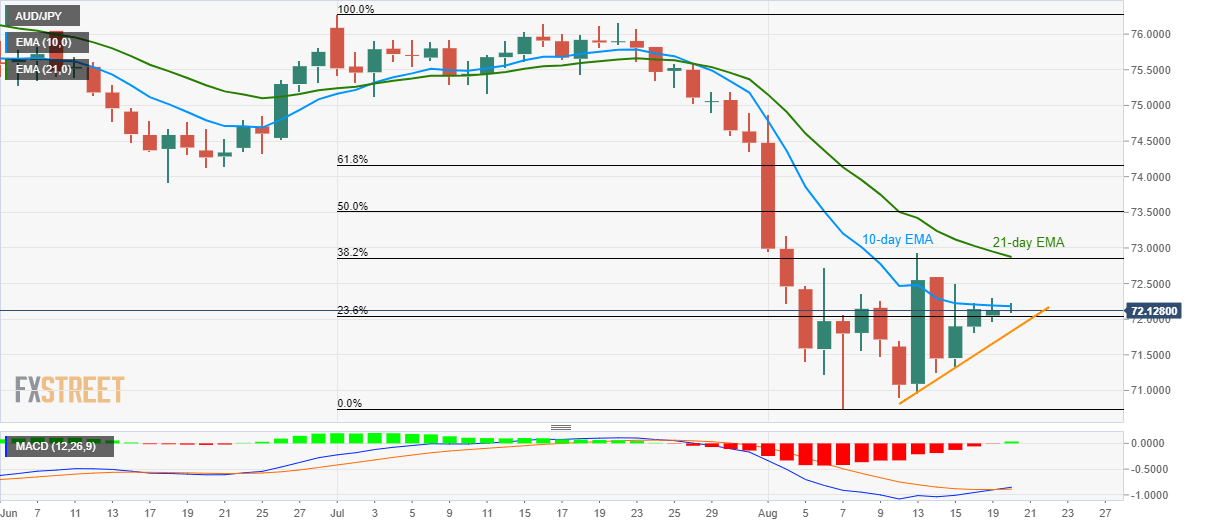
Despite clearing 23.6% Fibonacci retracement of July-August declines, AUD/JPY struggles to cross 10-day exponential moving average (EMA) while taking rounds to 72.13 on Tuesday’s early Asian session.
A sustained break of 72.20 immediate resistance can propel prices to 72.85/87 confluence area including 21-day EMA and 38.2% Fibonacci retracement whereas August 02 high near 73.18 and 50% Fibonacci retracement near 73.51 could lure buyers next.
Supporting to the buying bets is the bullish signal by 12-bar moving average convergence and divergence (MACD) technical indicator.
If traders chose to ignore the technical signal with a pull below 23.6% Fibonacci retracement level of 72.00, a week old rising trend-line near 71.80 can question further declines.
In a case where prices slip below 71.80 on a daily closing basis, a fresh downpour to 71.50, 71.20 and 70.75/74 can’t be ruled out.
AUD/JPY daily chart
Trend: Recovery expected
