- AUD/JPY struggles around 23.6% Fibonacci retracement even after breaking a week-long symmetrical triangle to the downside.
- Bearish MACD, sustained trading below 4H 100MA favor sellers.
Even after breaking one-week-old symmetrical triangle formation, AUD/JPY clings to 23.6% Fibonacci retracement of late-July to early-August downpour as it trades near 72.00 amid initial Asian session on Wednesday.
Not only a downside break of the triangle, bearish signal by 12-bar moving average convergence and divergence (MACD) indicator also favor sellers targeting August 11 low close to 71.40.
In a case prices slip beneath that monthly bottom near 70.70 and 70.00 round-figure will be on bears’ list.
On the upside, a downward sloping trend-line at 72.30 and 100-bar moving average on the four-hour chart (4H 100MA) at 72.42 can limit near-term advances.
AUD/JPY 4-hour chart
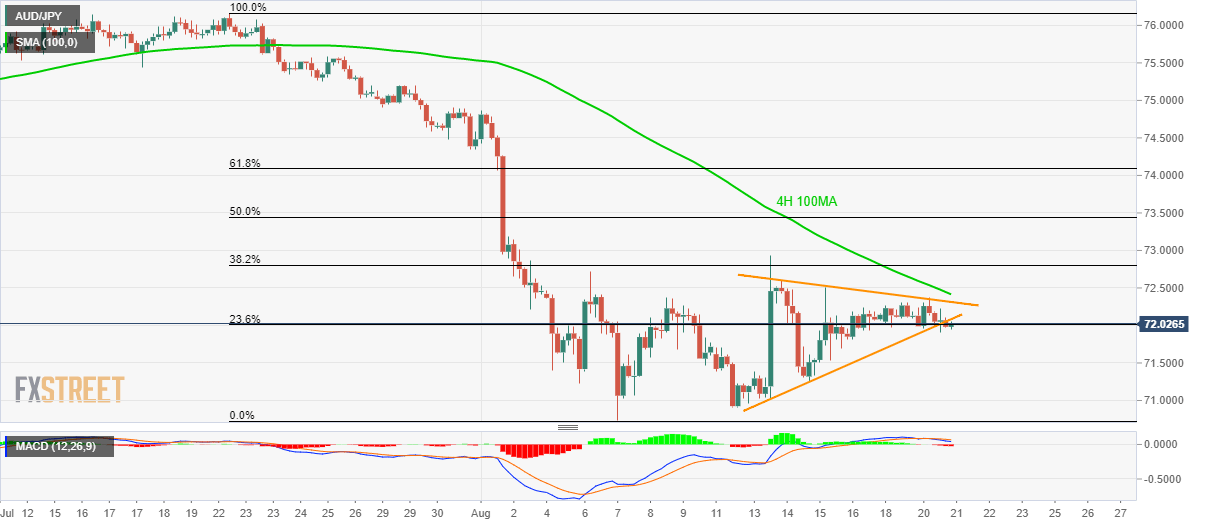
Trend: Bearish
