- Traders gave little importance to China’s mixed trade balance data.
- The descending triangle in place to observe.
AUD/JPY is on the rounds near 77.30 after China’s trade balance data posted mixed results on early Wednesday.
Traders were struggling to determine near-term trade direction after China’s April month trade balance data showed an overall reduction in trade surplus confronting increasing exports on CNY basis and rise in the USD based import growth.
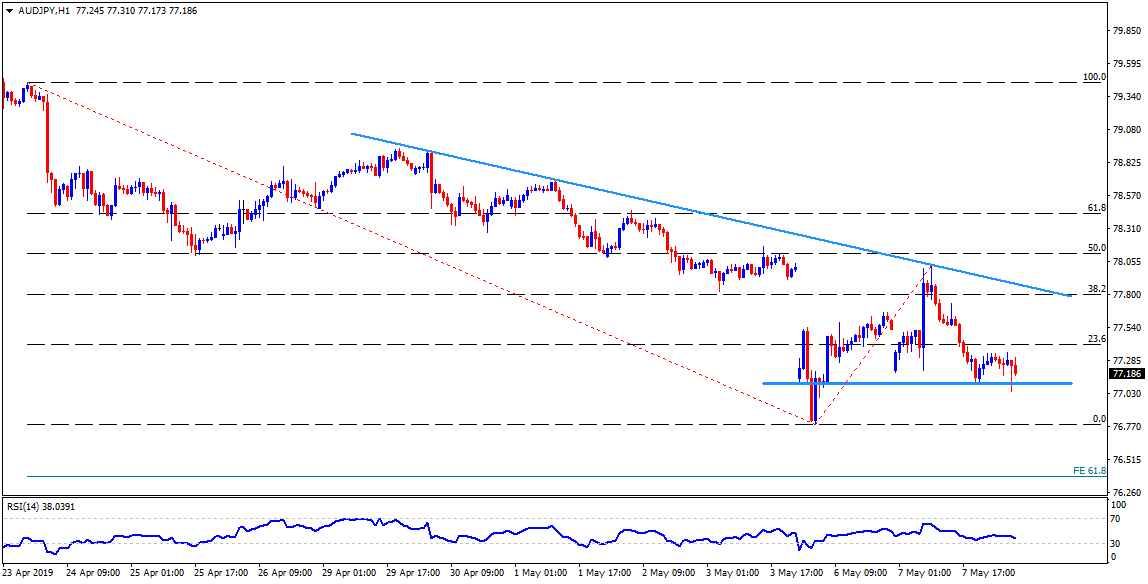
Technically, the pair follows a short-term descending triangle formation on the hourly chart with the pattern’s lower-line at 77.10 being immediate support.
Should prices slip under 77.10, latest lows near 76.80 and 61.8% Fibonacci expansion of April 24 to May 07 moves near 76.40 could gain traders’ attention.
On the flipside, 23.6% Fibonacci retracement of late-April to May month decline, at 77.40 may restrict nearby upside, a break of which can propel the quote to 77.70 ahead of challenging the formation resistance of 77.90.
If there prevails a rise above 77.90 78.15 and 78.45 can flash on the chart.
AUD/JPY hourly chart
Trend: Sideways
