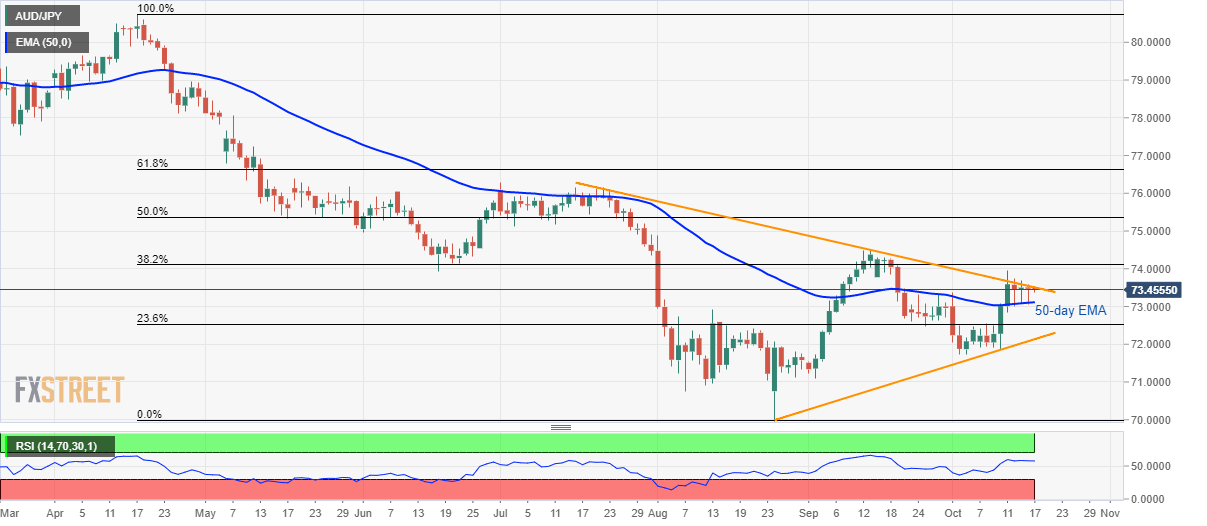
- AUD/JPY struggles between 50-day EMA and a three-month-old falling trend line.
- RSI signals no surprises together with the triangle formation that favors the continuation of the existing trend.
Despite bouncing off 50-day Exponential Moving Average (EMA), the AUD/JPY pair stays inside a multi-month old symmetrical triangle while taking rounds to 73.45 during Thursday morning in Asia.
With the 14-bar Relative Strength Index (RSI) signaling no major surprises ahead, price momentum above short-term key EMA needs a sustained break above the pattern’s resistance line, at 73.55 now, in order to accelerate the latest recovery.
In doing so, September month high of 74.50 and 50% Fibonacci retracement level of April-August downpour, at 75.40, could please buyers.
Alternatively, pair’s daily closing below 50-day EMA level of 73.10 can test 23.6% Fibonacci retracement level of 72.53 ahead of visiting pattern’s support line figure of 72.14.
If at all sellers sneak in around 72.10, also clear 72.00 round-figure, 70.80 and 70.00 will flash on their radars.
AUD/JPY daily chart
Trend: sideways
