- AUD/JPY struggles to extend the latest upside beyond a fortnight high.
- 38.2% Fibonacci retracement, four-week-old falling trend-line limit the upside towards 73.18/22 resistance-confluence.
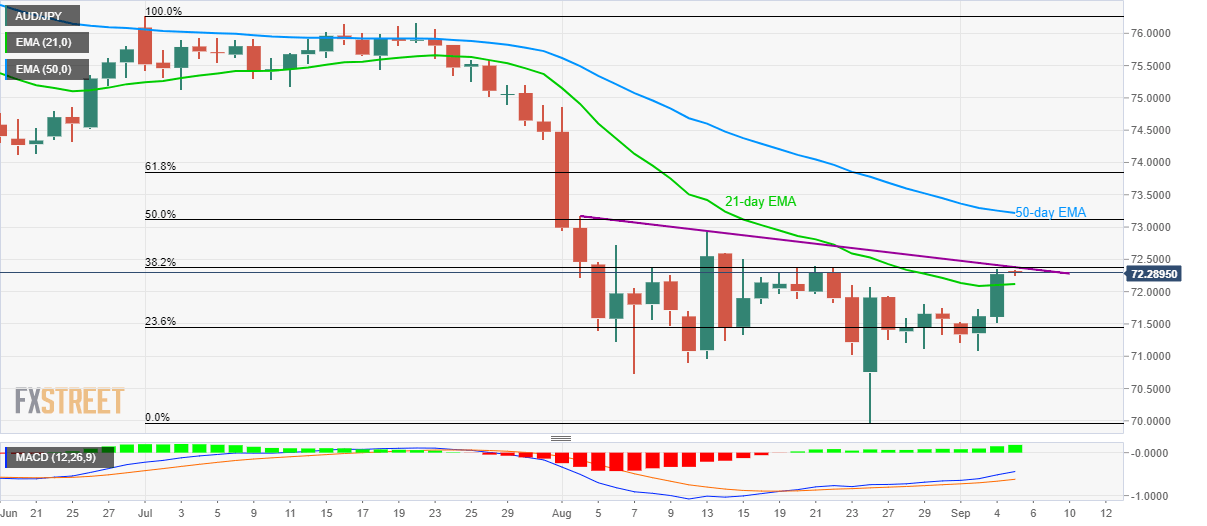
- 21-day EMA acts as immediate support to watch during the pullback.
Despite rising to a two-week high, AUD/JPY still falls short of breaking near-term key technical levels as it makes the rounds to 72.90 during initial Thursday morning in Asia.
A downward sloping trend-line since August 02 and 38.2% Fibonacci retracement of July-August downpour limit the pair’s immediate upside around 72.37/38, a break of which could escalate the run-up towards 73.18/22 area including August 02 high and 50-day exponential moving average (EMA).
In a case prices rally beyond 73.22, 61.8% Fibonacci retracement level of 73.85 and 74.00 round-figure could please buyers.
Alternatively, sellers will wait for the pair’s break below 21-day EMA level of 72.12 in order to aim for August 29 top surrounding 71.80.
However, 71.00 and 70.70 could question the pair’s declines past-71.80, if not then 70.00 will come back to the charts.
AUD/JPY daily chart
Trend: pullback expected
