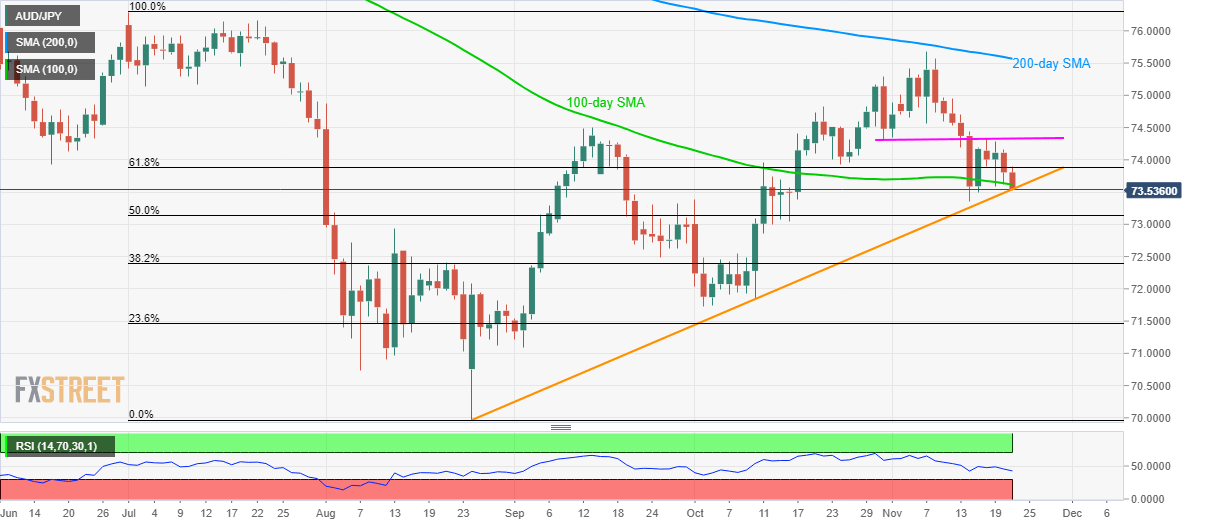
- AUD/JPY drops to the near-term key support confluence.
- Buyers will look for an upside break of 74.30/35.
- Bears can watch over 50% Fibonacci retracement during further declines.
Following its lower high formation since Monday, AUD/JPY tests the key support confluence while taking rounds to 73.60 during Thursday’s Asian session.
Although the presence of 100-day Simple Moving Average (SMA) and an upward sloping trend line since late-August question sellers, gradually descending conditions of 14-bar Relative Strength Index (RSI) and market’s rush towards risk-safety seems to drag the pair below 73.55/50 support confluence.
In doing so, 50% Fibonacci retracement of July-August declines, at 73.13, followed by 73.00 round-figure, will be on bear’s radar whereas 72.55 and October month low of 71.73 could please them afterward.
Alternatively, prices need to clear 74.30/35 horizontal area including October-end low and the present week’s high to revisit 74.55 and 75.30 numbers to the north. However, a 200-day SMA level of 75.57 will becomes a tough nut to crack for buyers then after.
AUD/JPY daily chart
Trend: Bearish

