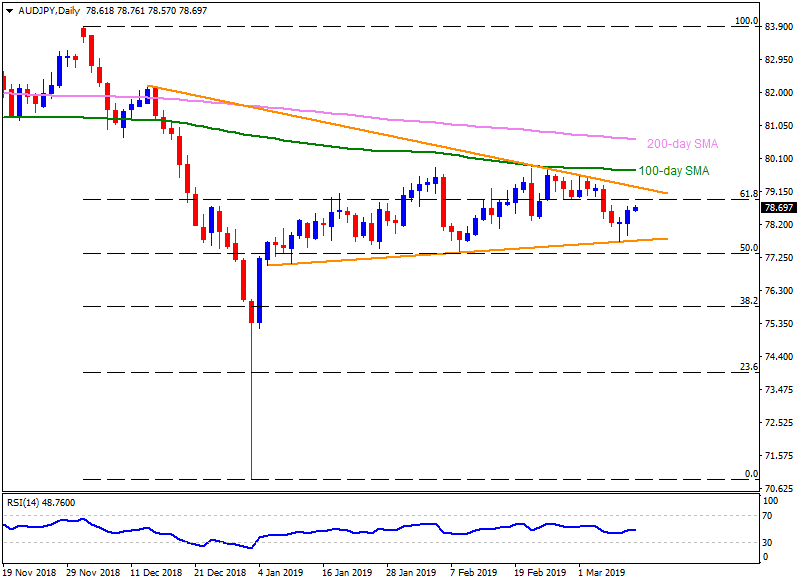
AUD/JPY daily chart
- AUD/JPY presently trades near 78.65 on early Tuesday.
- The pair dropped nearly 20 pips after softer than expected figures of NAB Business Confidence and Conditions.
- 61.8% Fibonacci retracement of December-January downturn can act as nearby resistance around 79.00 on daily chart, a break of which can shift market attention to a descending trend-line established since mid-December, at 79.35.
- In a case prices rally beyond 79.35 on a daily closing basis, 100-day simple moving average (SMA) near 79.75, 80.00 and 200-day SMA level of 80.65 may flash on bulls’ radar.
- Alternatively, 78.30 and 78.00 may offer immediate supports to the pair ahead of highlighting nine-week long support-line, at 77.70.
- Given the pair’s drop under 77.70, 50% Fibonacci retracement level of 77.30, followed by 77.00, may become sellers’ favorites.
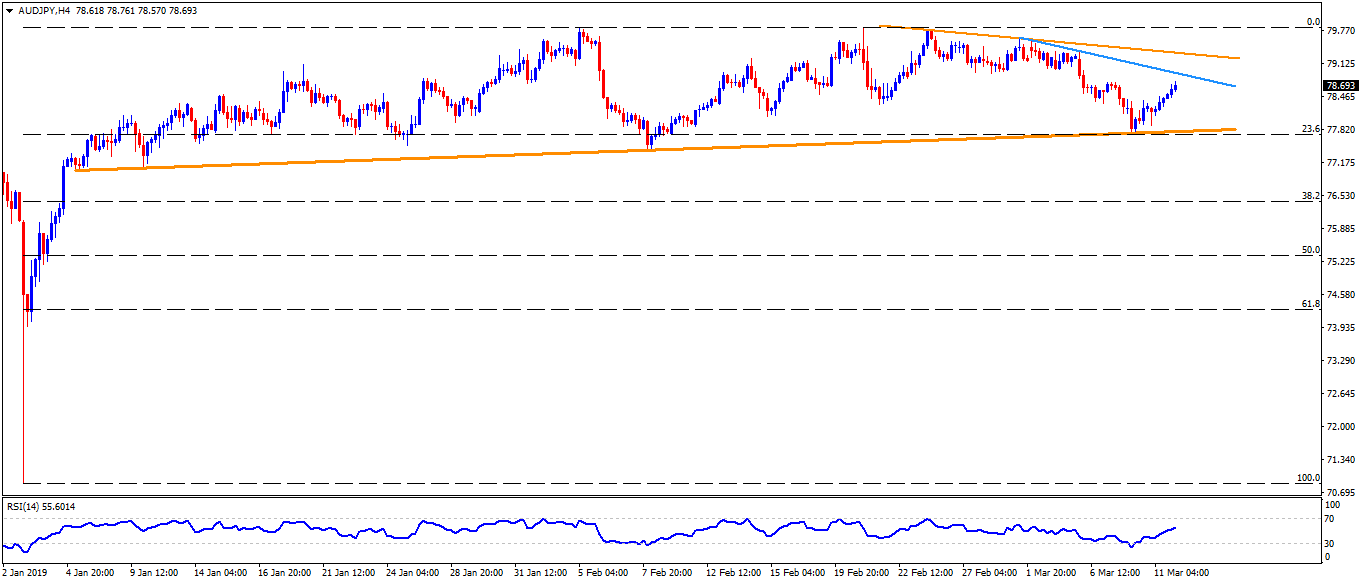
AUD/JPY 4-Hour chart
- On a four-hour chart, 79.80 can validate the pair’s rise towards 80.00 after crossing 79.75 whereas 78.10 may provide buffer between 78.30 and 78.00.
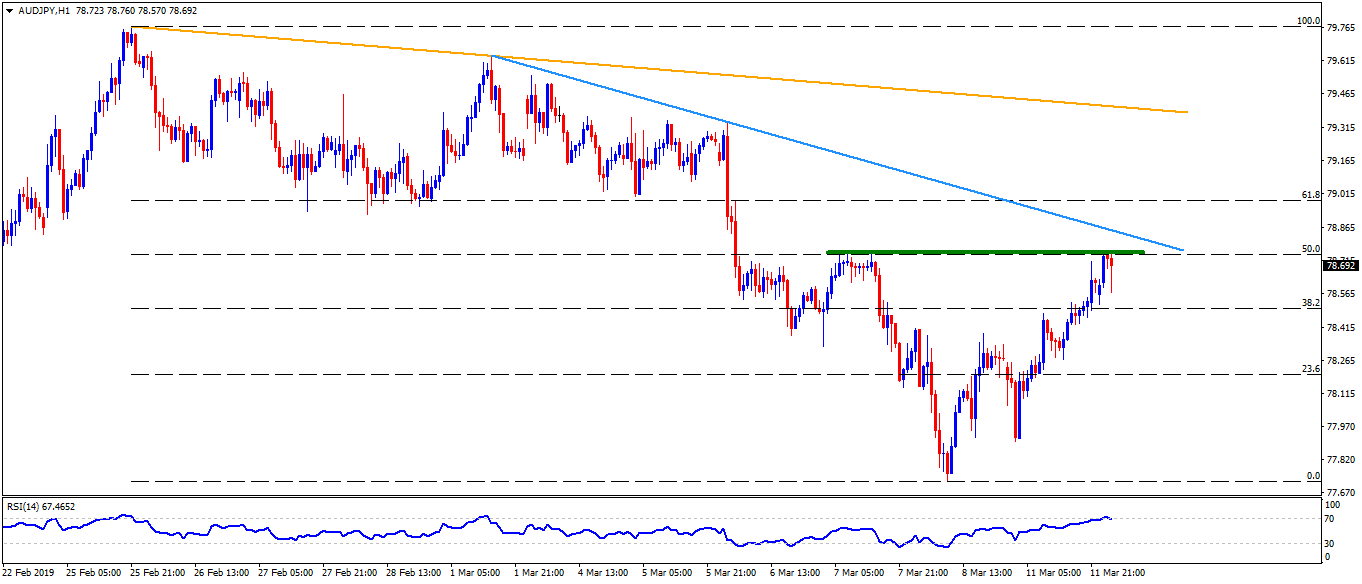
AUD/JPY hourly chart
- 50% Fibonacci retracement of February 25 to March 08 decline, at 78.75 again played its role in limiting the pair’s upside (as it did on last Thursday), which in turn signal brighter chances of its pullback to 78.30, 78.10 and 78.00.
- On the upside clearance of 78.75, a downward sloping trend-line connecting March highs, at 78.85, could provide immediate resistance to the pair.