- Failure to slip beneath 50% Fibonacci retracement, oversold RSI favors AUD/JPY pullback.
- The 2-day long descending trend-line acts as an additional resistance beyond 200-HMA.
- The Aussie employment data in the spotlight for fresh impulse.
Despite declining below the 200-hour moving average (HMA), the AUD/JPY pair bounced off 50% Fibonacci retracement of last one-week moves as it takes near 75.65 during the early Asian session on Thursday.
While sustained trading below key HMA pleases bears, oversold levels of 14-bar relative strength index (RSI) and failure to decline below 50% Fibonacci retracement favors the buyers targeting a break of 75.71 upside barrier comprising 200-HMA.
Following a successful break of 75.71, bulls may have to cross the 2-day old resistance-line at 75.88 now in order to revisit the latest highs surrounding 76.15.
Meanwhile, sellers will look for 61.8% Fibonacci retracement level near 75.54 during the pair’s extended declines below 75.66 including 50% Fibonacci retracement.
It should also be noted that 75.35 and 75.17 can offer additional support to the quote if bears dominate past-75.54.
Other than the technical details, traders will observe Australia’s June month employment data to forecast near-term pair moves. The Aussie Employment Change is expected to decline to 10K from 42.3K prior whereas Unemployment Rate may remain unchanged at 5.2%.
AUD/JPY hourly chart
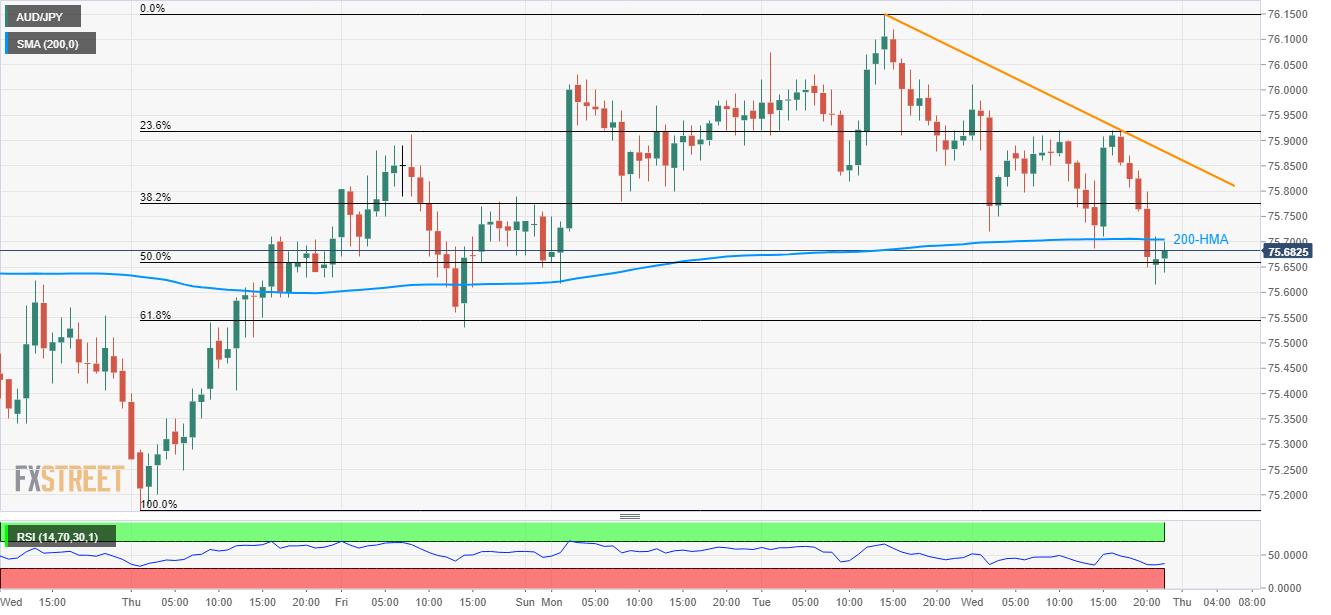
Trend: Sideways
