- AUD/JPY trades near the one month low.
- 12-week-old rising support line questions further declines.
- 50% and 61.8% Fibonacci retracement levels guard immediate upside.
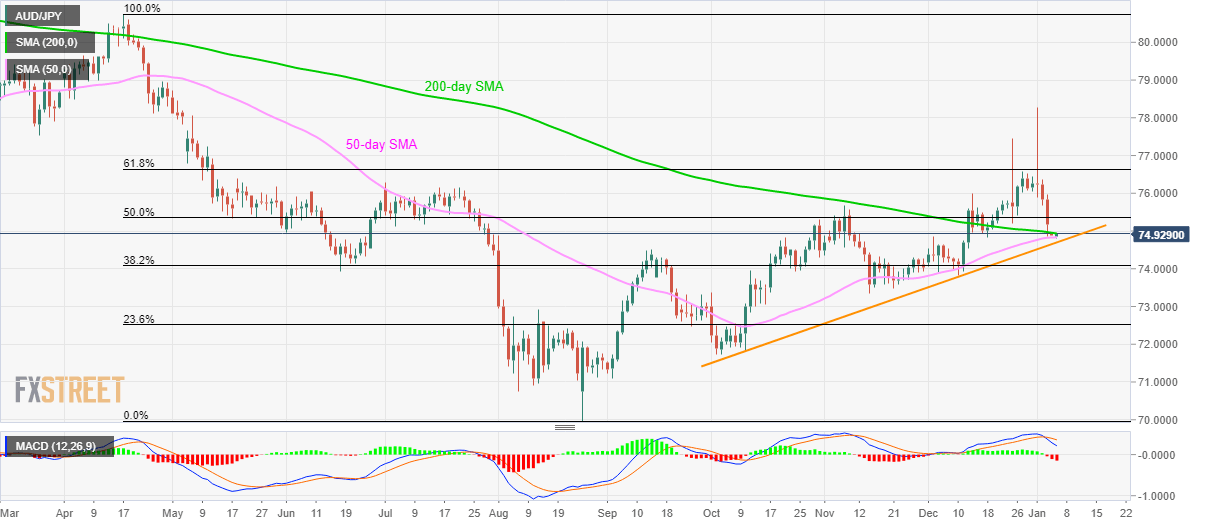
AUD/JPY confronts a 200-day SMA level of 74.93 during the initial Asian session on Monday. That said, the pair recently bounced off a 50-day SMA level of 74.83.
Given the bearish signals from 12-bar MACD, coupled with a downside break of 200-day SMA, AUD/JPY prices are likely to test an ascending trend line since October 10, at 74.70 now, during further declines. However, a break of 50-day SMA level becomes a precondition for the same.
In a case where the quote slips below 74.70 on a daily closing basis, 38.2% Fibonacci retracement of April-August 2019, at 74.09, will be on the Bear’s radar.
On the upside, a daily close beyond 200-day SMA level of 74.93 can escalate the recent recovery towards 50% and 61.8% Fibonacci retracement levels of 75.36 and 76.63.
Though, 76.00 round figure and July month high near 76.30 can offer intermediate halts during the rise.
AUD/JPY daily chart
Trend: Bearish
