- Sustained break of an ascending triangle signal further downside.
- The data from Japan and Australia are in the spotlight for now.
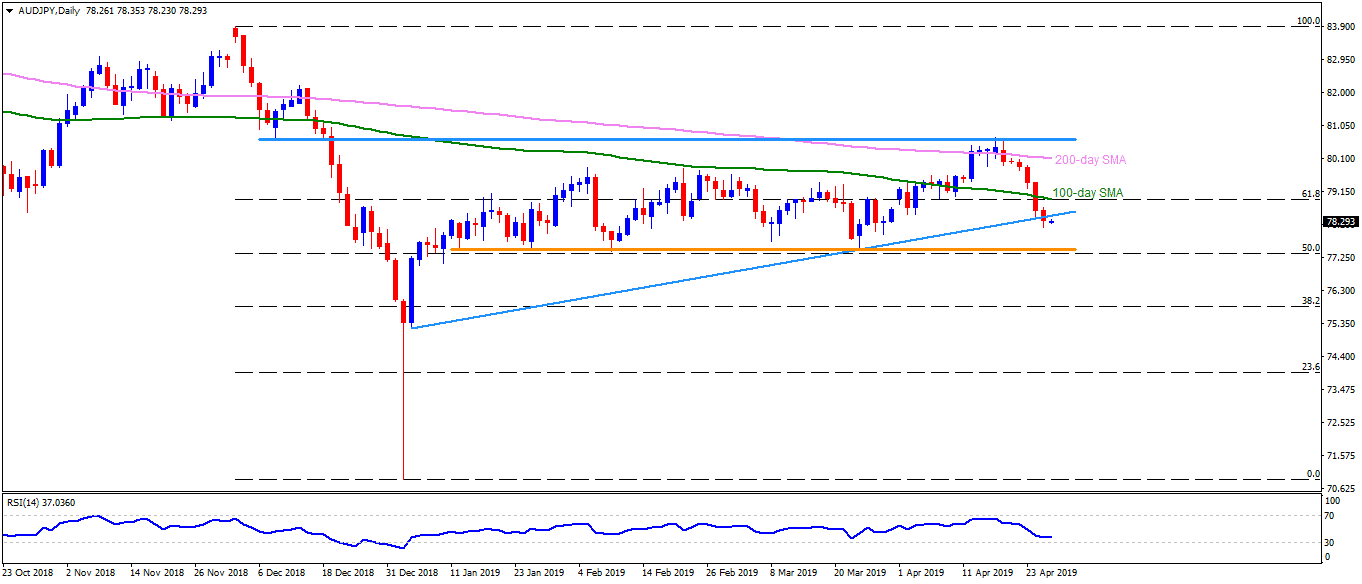
AUD/JPY trades near 78.30 during the early Asian session on Friday. The quote slipped beneath an upward sloping trend-line stretched since January 04, therefore, confirming an ascending triangle break.
Traders await Japan’s Tokyo Core CPI and Australia’s price measures for immediate direction.
With this, the quote can continue highlighting 77.50 horizontal-line comprising multiple lows marked since mid-January, a break of which may recall 77.00 on sellers’ radar.
If at all bears rule trade sentiment under 77.00, 76.00 and 75.30 could become their favorites.
Meanwhile, an upside clearance of 78.50 support-turned-resistance can trigger the pair’s recovery in direction to 78.95 – 79.00 area including 100-day simple moving average (SMA) and 61.8% Fibonacci retracement level of December 2018 to January 2019 decline.
During further upside beyond 79.00, 79.80, 80.00 and 200-day SMA level of 80.15 can entertain buyers ahead of challenging them with 80.65/70 horizontal-region.
AUD/JPY daily chart
Trend: Bearish
