- Failure to cross 50-day simple moving average (SMA) on daily chart, coupled with disappointing China trade balance data, seems dragging the AUD/JPY pair currently towards south on early Friday.
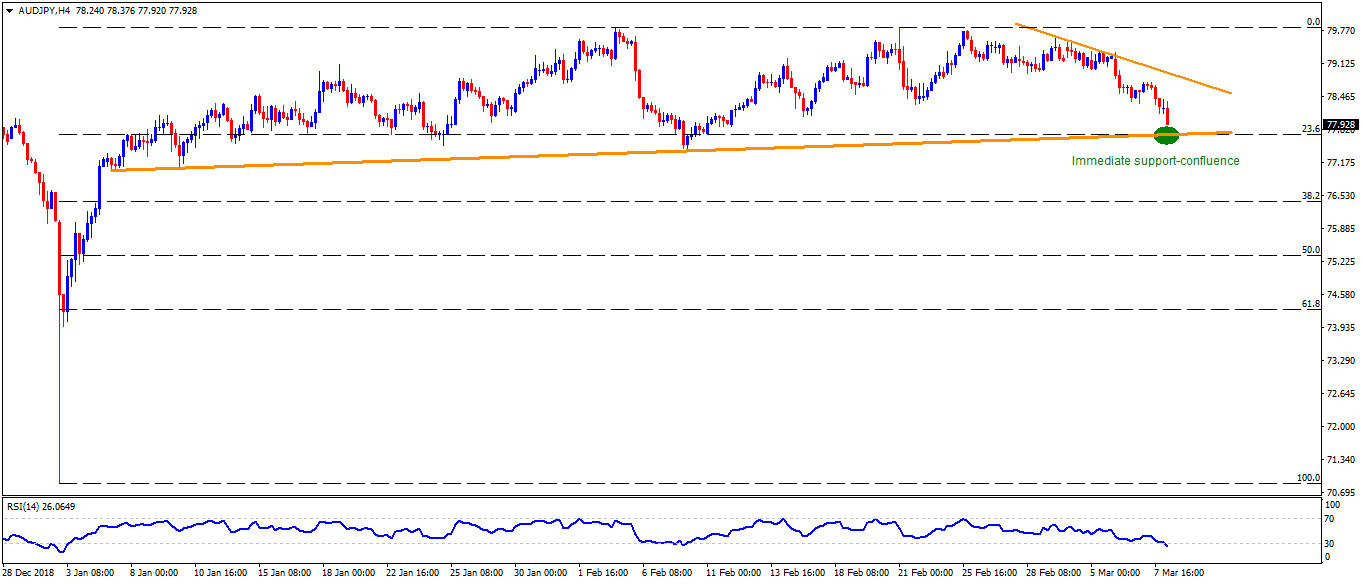
- Sellers look for 77.70 as an important level as it shows a confluence between an upward slopping trend-line connecting lows since January 07 and 23.6% Fibonacci retracement level of its January – February moves.
- Should the pair drops under 77.70, it can quickly test 77.00 and head to 76.00 rest-point then after.
- However, 75.30/25 may limit the pair’s further downside.
- It’s worth pointing out that 14-bar relative strength index (RSI) is in the oversold territory and failure to break 77.70 can trigger the quote’s pullback to the 50-day SMA level of 78.40.
- In case prices rally beyond 78.40, descending trend-line at 78.95, followed by 79.00 and 79.35, can please the Bulls.
AUD/JPY 4-Hour chart
Additional important levels:
Overview:
Today Last Price: 78.02
Today Daily change: 22 pips
Today Daily change %: -0.28%
Today Daily Open: 78.24
Trends:
Daily SMA20: 78.86
Daily SMA50: 78.39
Daily SMA100: 79.76
Daily SMA200: 80.67
Levels:
Previous Daily High: 78.76
Previous Daily Low: 78.15
Previous Weekly High: 79.79
Previous Weekly Low: 78.91
Previous Monthly High: 79.85
Previous Monthly Low: 77.44
Daily Fibonacci 38.2%: 78.38
Daily Fibonacci 61.8%: 78.53
Daily Pivot Point S1: 78
Daily Pivot Point S2: 77.77
Daily Pivot Point S3: 77.39
Daily Pivot Point R1: 78.62
Daily Pivot Point R2: 78.99
Daily Pivot Point R3: 79.23
