- AUD/NZD stays bid near the highest since October 2018.
- A sustained break of 11-month-old horizontal resistance, a descending trend line from October 2017 favors the bulls.
- 1.1000 psychological magnet becomes immediate resistance to watch.
- Sellers are less likely to enter unless witnessing a break below 1.0880.
AUD/NZD takes the bids near 1.0985 amid the early-Asian session on Monday. In doing so, the aussie cross refreshes the highest levels since late-2018 while extending the last week’s run-up beyond the key resistance lines, now supports.
While a clear break of a falling trend line from October 2017 propels the quote towards the 1.1000 threshhold, any further upside might be capped by overbought RSI conditions, which if ignored will push the buyers to September 2018 top surrounding 1.1065.
In a case where the AUD/NZD prices keep rallying past-1.1065, the year 2018 peak close to 1.1190 will be in the spotlight.
On the contrary, 1.0940 may offer immediate support during the pair’s pullback ahead of highlighting the multi-week-old falling trend line around 1.0910/05.
It should, however, be noted that the highs marked in November 2019 and June 2020 restrict the pair’s further downside around 1.0880.
AUD/NZD weekly chart
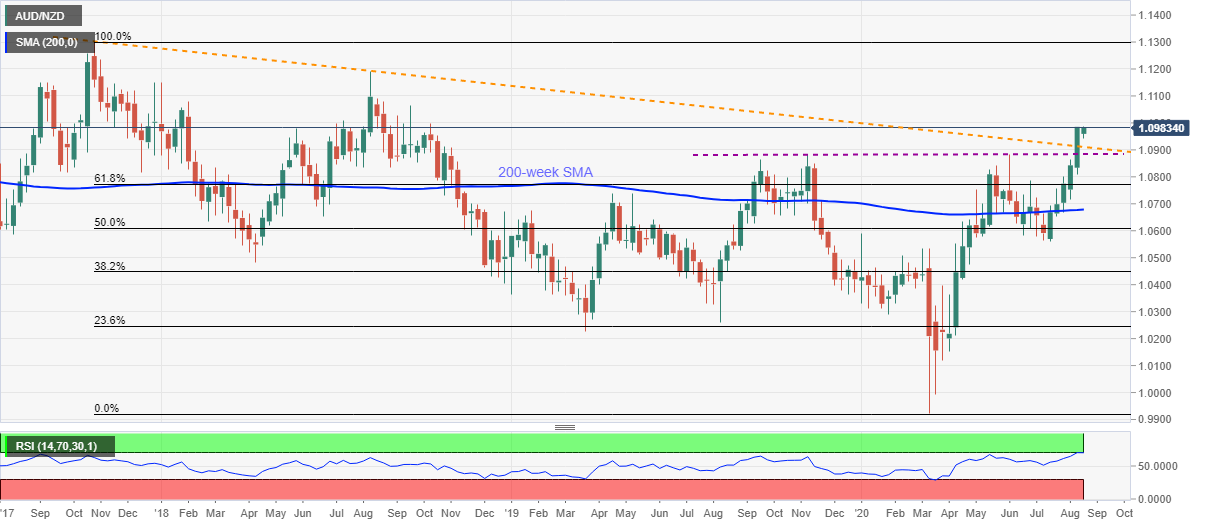
Trend: Bullish
