- Bias continues to point to the downside in AUD/NZD.
- Price testing the dynamic support at the 55-SMA.
- Key event ahead: Reserve Bank of Australia meeting on Tuesday.
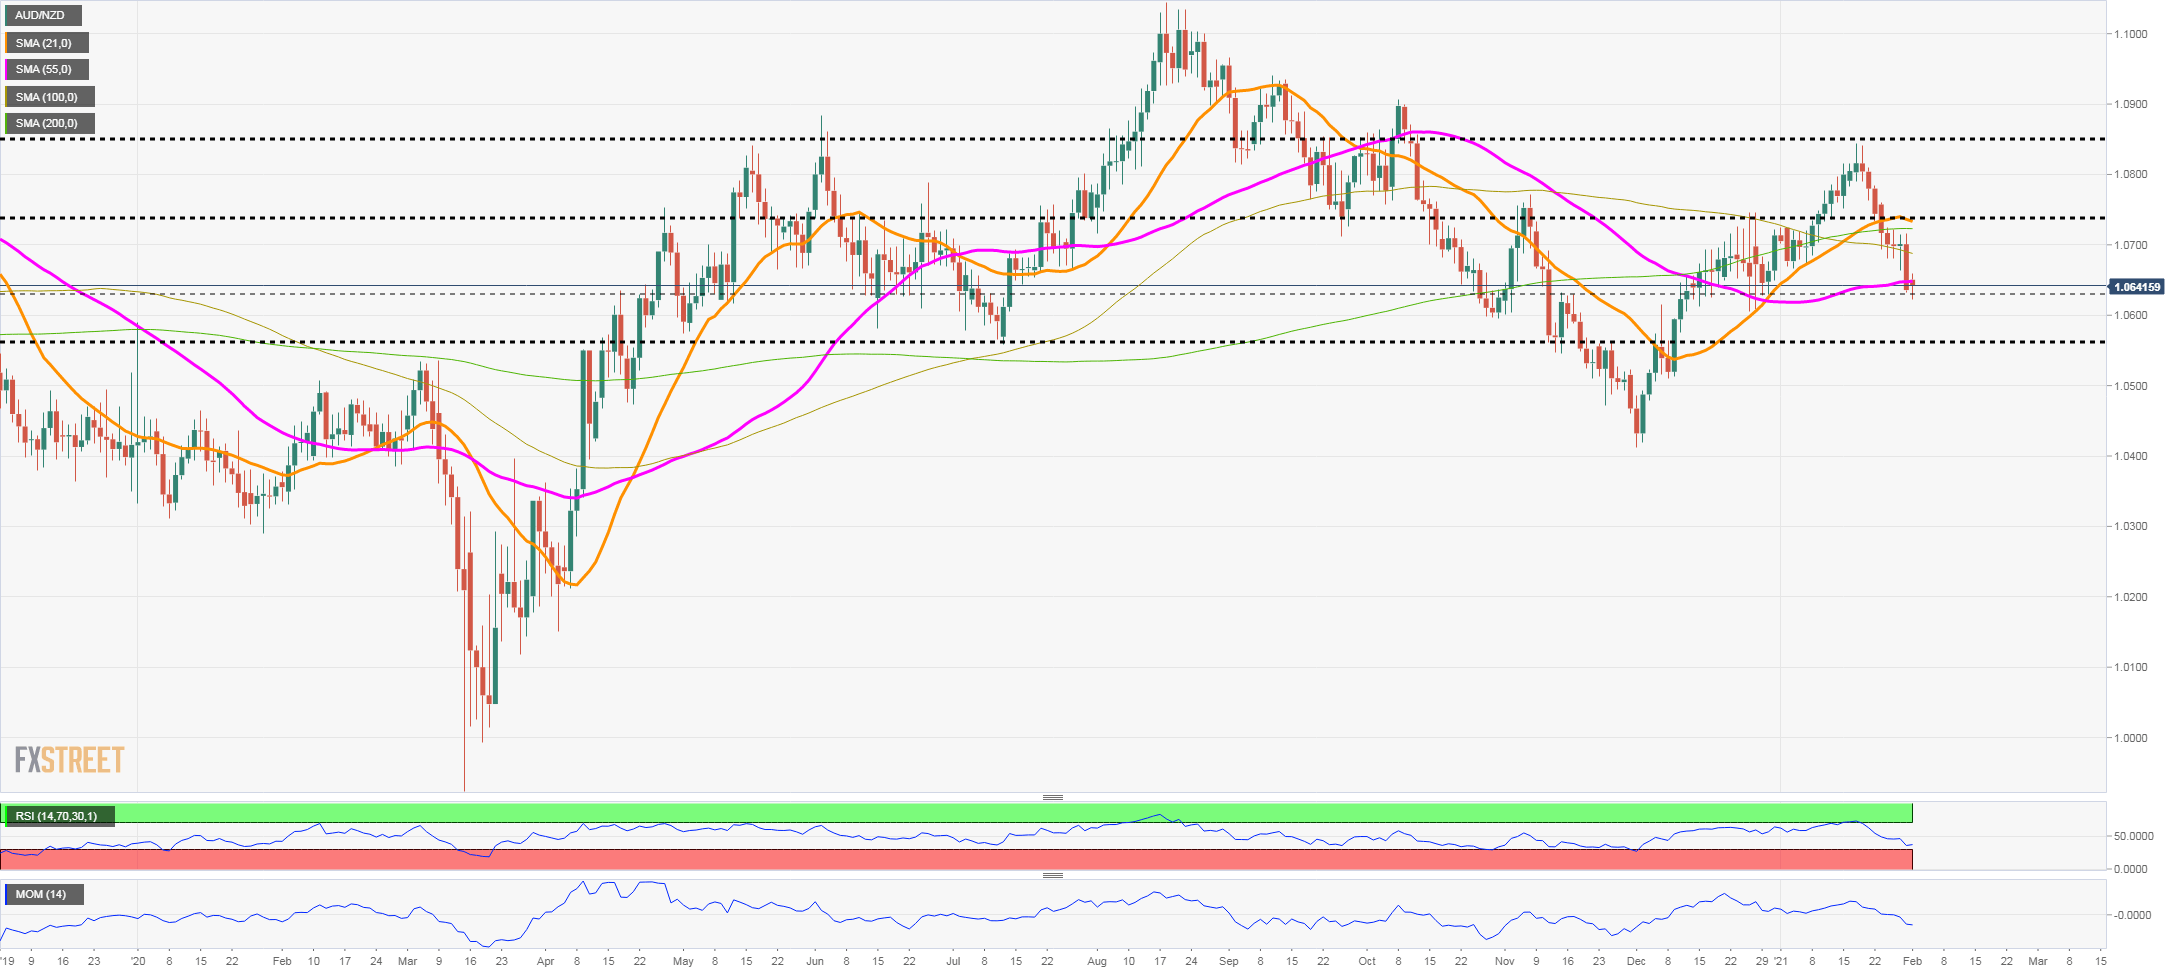
The AUD/NZD continues to decline after hitting two weeks ago at 1.0843, the highest level since mid-October. After breaking under 1.0800, it accelerated the decline. The retreat continued until it found support on Friday at 1.0630/50, where the 55-day simple moving average stands.
Technical indicators in the daily chart point to more weakness ahead. The kiwi needs a firm break under the 1.0620 zone to clear the way to more losses. The next target could be seen at 1.0570 with an intermediate support at 1.0600.
After falling in eight out of the last nine trading days, a consolidation looks overdue. Still, the outcome of the RBA meeting could trigger sharp moves in the aussie.
A consolidation could occur between the 55-day SMA and the 20-day SMA that stands at 1.0735/40, also a horizontal resistance. A daily close above 1.0740 would strengthen the aussie.
AUD/NZD daily chart