- AUD/NZD extends losses from five-week high after upbeat New Zealand (NZ) GDP.
- NZ Q3 GDP crosses market consensus in Q3, upward revision to Q2 figures also favors the pair sellers.
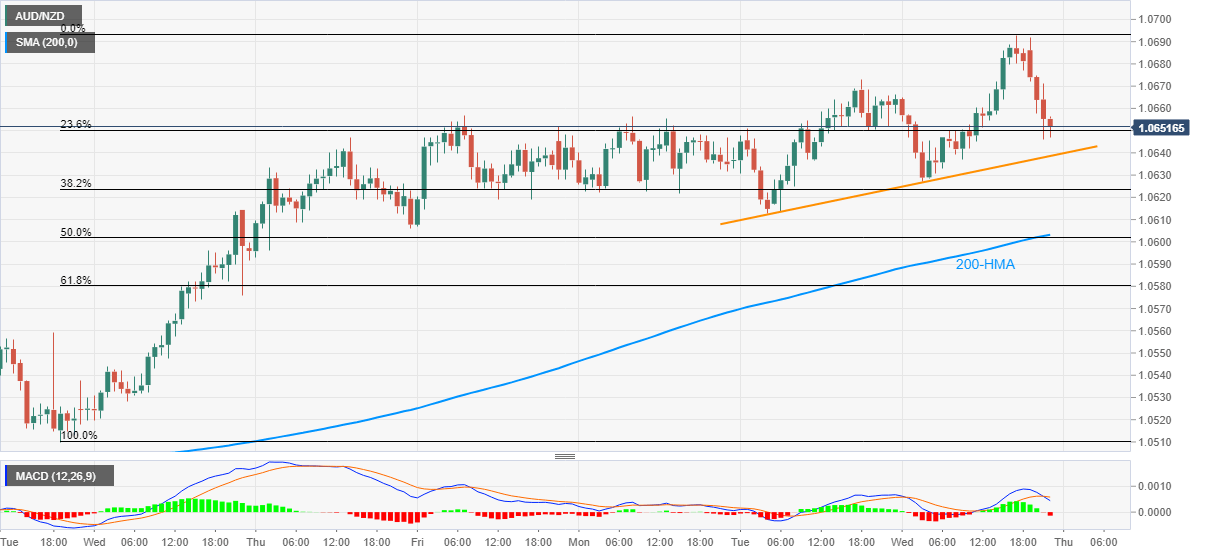
- MACD turns bearish but two-day-old support line, 200-HMA.
AUD/NZD stretches the downside momentum to 1.0645, currently at 1.0652, during the early Asian trading on Thursday. The pair took a U-turn from a multi-day high before a few hours while an upbeat print of NZ Q3 GDP offered additional strength to the New Zealand dollar (NZD) buyers.
Read: NZ GDP sa (QoQ) Q3: 14.0% (exp 12.9%; prev -12.2%)
Although the recent declines dragged MACD histogram into the red, immediate support line at 1.0638, followed by 200-HMA level around 1.0600, challenge the AUD/NZD bears.
Also acting as a downside filter is 61.8% Fibonacci retracement of the pair’s run-up from December 08, near 1.0580.
Meanwhile, Tuesday’s high near 1.0675 guards immediate upside ahead of the latest top, also the highest since November 09, close to 1.0700.
In a case where the quote manages to cross the 1.0700 threshold, November’s peak surrounding 1.0770 will gain the AUD/NZD bull’s attention.
AUD/NZD hourly chart
Trend: Pullback expected
