- AUD/NZD stands on slippery ground following the RBNZ status-quo.
- Bullish signals from RBNZ joins bearish MACD, sustained break of the key trend lines to favor sellers.
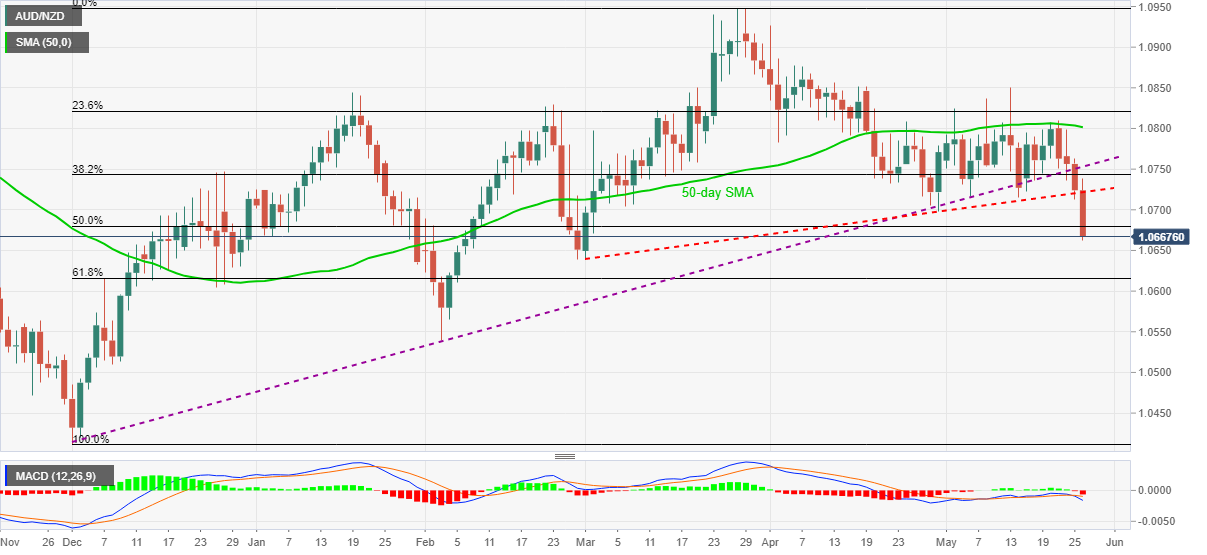
- 50-day SMA adds to the upside barriers, 61.8% Fibonacci retracement level lures the bears.
AUD/NZD extends the RBNZ-led declines to 1.0660, down 0.58% intraday, during early Wednesday.
Although the RBNZ matched wide market forecasts of announcing no policy change, the New Zealand’s (NZ) central bank’s signals to hike the benchmark rates from 0.25% current levels during late 2022 seem to put a strong bid under the New Zealand dollar (NZD).
Technically, the pair’s sustained break of ascending support lines from early December 2020 and March 2021, respectively around 1.0720 and 1.0750, joins the bearish MACD to back the AUD/NZD sellers.
Also favoring the south-run could be the pair’s break of 50% Fibonacci retracement of December-March upside.
Hence, the latest fall seems to target the 61.8% Fibonacci retracement level of 1.0616 should the RBNZ Press Conference push for the rate hike. However, the late February lows near 1.0640 can offer an intermediate halt during the south-run.
On the contrary, corrective pullback needs to bounce back beyond 50% Fibonacci retracement level of 1.0680 to direct AUD/NZD buyers toward the short-term resistance line near 1.720 before highlighting the broader one near 1.0750.
Though, AUD/NZD bulls may not be able to regain control until crossing the 50-day SMA level of 1.0800 on a daily closing basis.
AUD/NZD daily chart
Trend: Bearish
