- Australian Dollar slipped across the board after Aussie employment data.
- 100-day SMA and 50% Fibonacci retracement can question the latest declines.
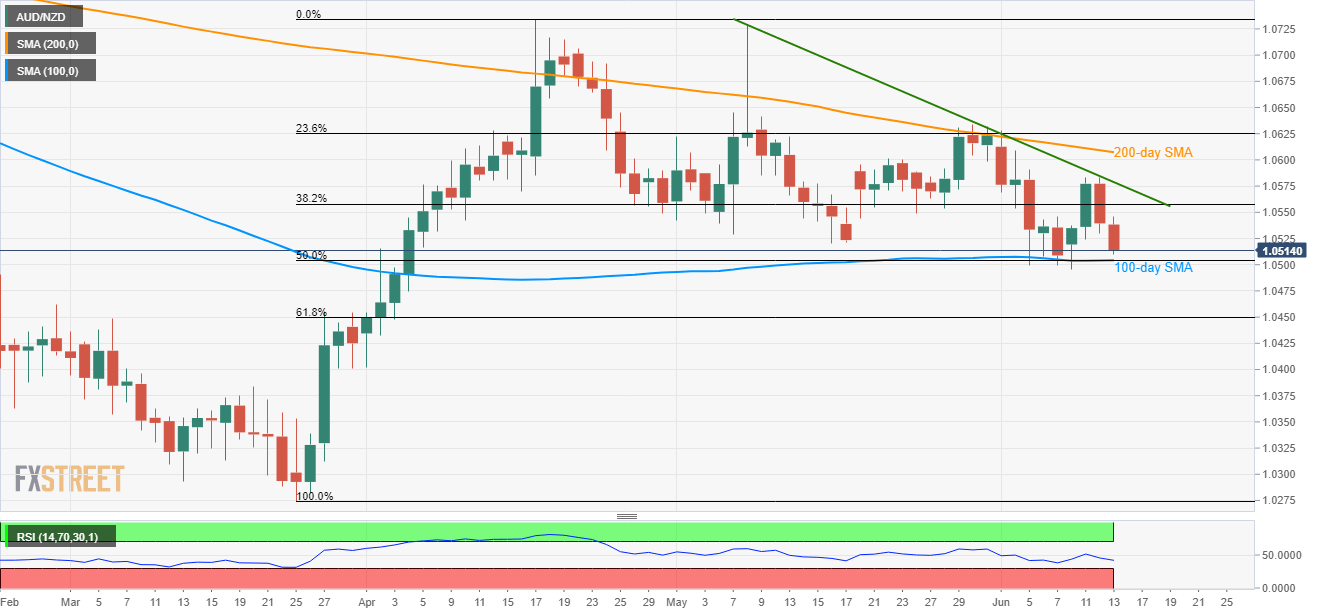
Although higher than expected Aussie unemployment rate dragged the AUD/NZD pair to a three-week low, it still is left to break 1.0500 support confluence to please the bears as it takes the rounds near 1.0520 during early Thursday.
50% Fibonacci retracement of March – April upside and 100-day simple moving average (SMA) highlight 1.0500 as the crucial level to beat for the bears targeting further downside towards 1.0475 and 61.8% Fibonacci retracement level around 1.0450.
If the 14-day relative strength index (RSI), presently in the normal region between 70 and 30, refrains from disturbing the downpour below 1.0450, late-March lows around 1.0400 could come back on the chart.
Meanwhile, 38.2% Fibonacci retracement near 1.0560 and a five-week-old descending trend-line at 1.0580 can keep limiting the quote’s short-term upside.
In a case where prices rally past-1.0580, 200-day SMA level of 1.0607 and May-end tops near 1.0634 might grab the spotlight.
AUD/NZD daily chart
Trend: Pullback expected
