- 200-day SMA can again play its role of resistance.
- RBNZ, China data in the spotlight.
Tuesday’s pullbacks from 1.0645 couldn’t disappoint AUD/NZD buyers as the quote remains on the bids around 1.0625 during early Wednesday.
A monetary policy meeting by the Reserve Bank of New Zealand and monthly trade balance data from China seem to be on traders’ radar.
RBNZ may offer a 0.25% cut to its official cash rate whereas China’s headline trade balance can rise to $35.00 billion from $32.67 billion in April.
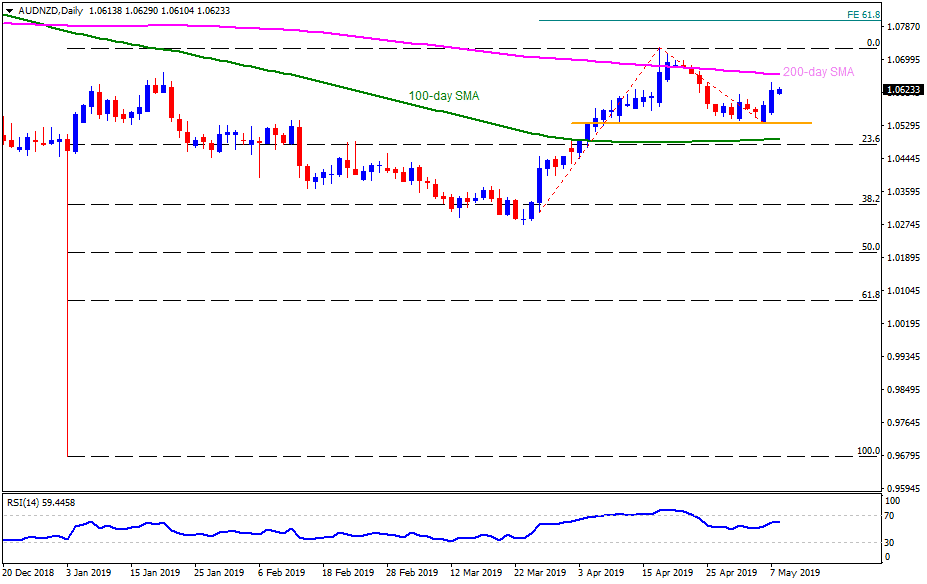
Considering pair’s current strength, as portrayed by 14-day relative strength index (RSI), 200-day simple moving average (SMA) level of 1.0665 acts as an immediate upside target for buyers past-1.0645.
However, 1.0700 and April top near 1.0730 may limit further upside, if not then 61.8% Fibonacci expansion (FE) of moves since March 27, 1.0800, could gain market attention.
Alternatively, 1.0570 as offer adjacent support during the pullback ahead of highlighting 1.0540/35 support-zone comprising lows since April 10.
Should there be an extended downturn beneath 1.0535, 100-day SMA level of 1.0500 and 23.6% Fibonacci retracement of January to April rise at 1.0480 might entertain sellers.
AUD/NZD daily chart
Trend: Positive
