The AUD/NZD pair is trading near 1.0680 during early Tuesday. The quote seems to form a bullish pennant pattern on the hourly chart and can confirm the upside to 1.0775 if clearing the 1.0690 formation resistance.
It should also be noted that 1.0700, 1.0715 and 1.0730 may entertain short-term buyers past-1.0690 and ahead of pleasing them with 61.8% Fibonacci expansion (FE) level of 1.0760.
Given the pair manage to remain strong past-1.0760, its theoretical target of 1.0775, followed by 1.0800, can appear on the Bulls’ radar.
Alternatively, a downside break of 1.0670 pattern support can recall 1.0660 and 1.0640 back on the chart.
However, 1.0620 and 61.8% Fibonacci retracement of its upside from April 08 to 17, near 1.0600, seem to play their role of support after 1.0640, if not then 1.0570 and 1.0530 are likely numbers to the south that the Bears could aim for.
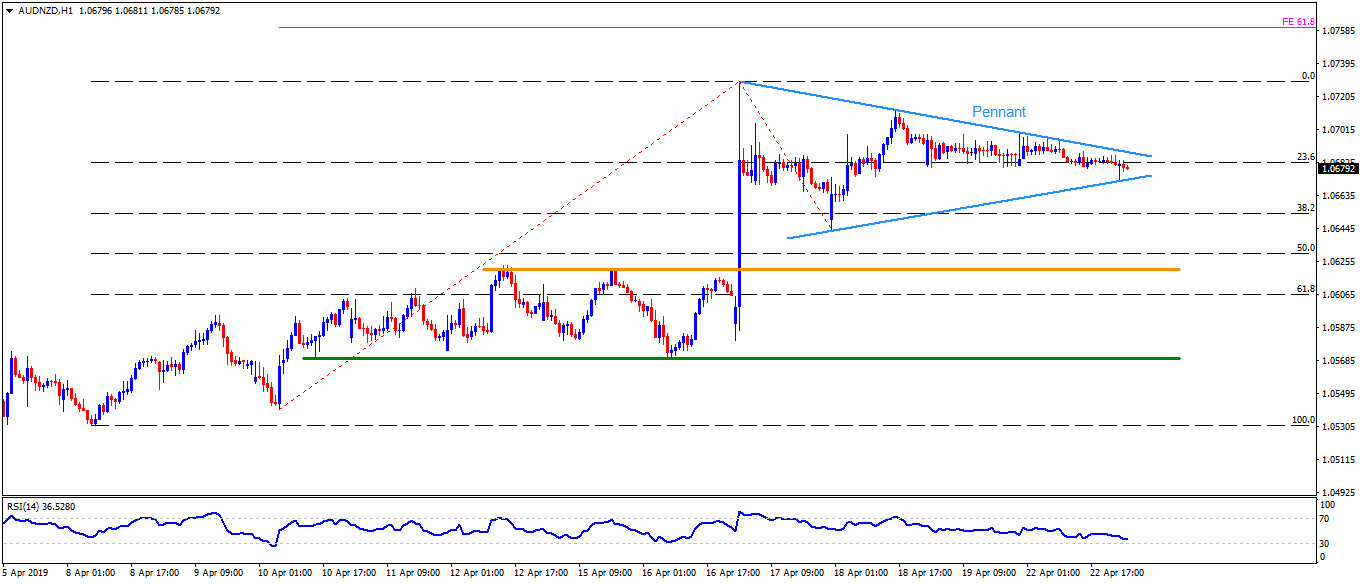
AUD/NZD hourly chart
Trend: Pullback expected
