- Break of 200-HMA signal further downside to near-term support-line.
- Oversold RSI question bears.
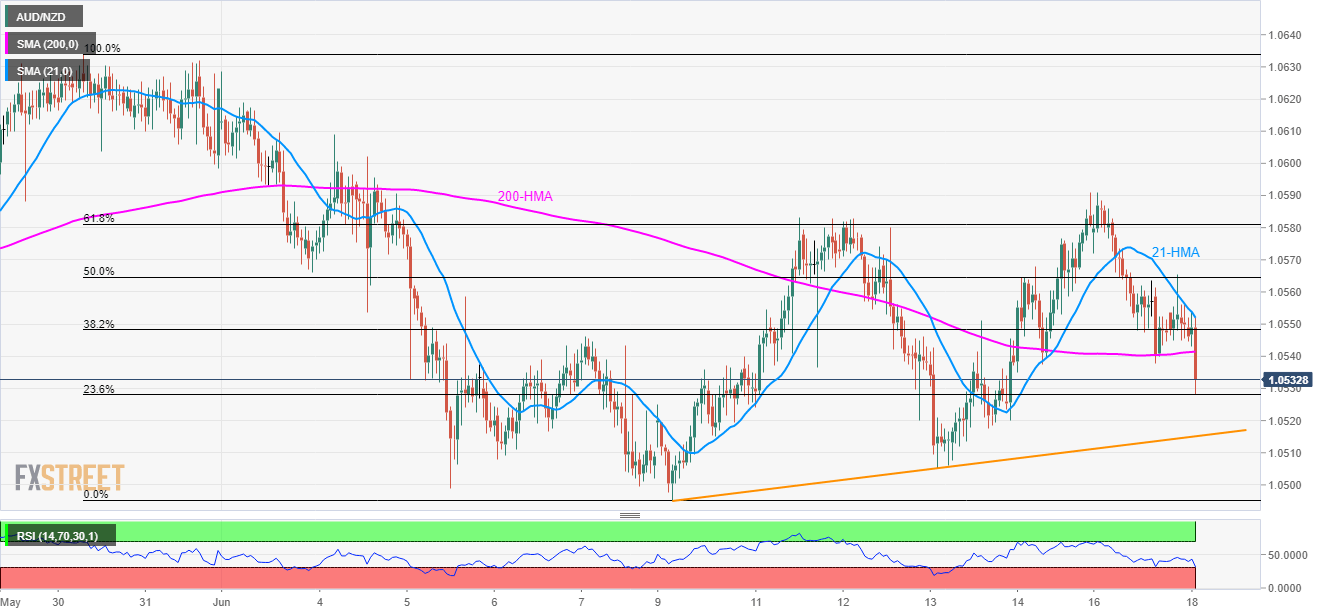
The downbeat tone of the RBA minutes and sluggish house price data from Australia dragged the AUD/NZD pair to 1.0530, below 200-hour moving average (HMA), during early Tuesday.
An upward sloping trend-line since May 10, at 1.0515 grabs sellers’ attention, for now, a break of which can push them towards current month low near 1.0495.
Should there be increased selling pressure past-1.0495, March 27 top near 1.0450 could become bears’ favorite.
Meanwhile, 21-HMA near 1.0555 seems the adjacent resistance for the pair traders to watch in case of a pullback.
If prices manage to clear 1.0555 upside barrier, 61.8% Fibonacci retracement of late-May to early June declines near 1.0580 and last week’s high surrounding 1.0590 could come back on the chart.
It is worth noting that the 14-bar relative strength index (RSI) is into the oversold territory indicating brighter chances of a U-turn.
AUD/NZD hourly chart
Trend: Bearish
