- AUD/NZD takes a U-turn from the multi-month low after RBA.
- Sellers look for entry below 61.8% Fibonacci retracement.
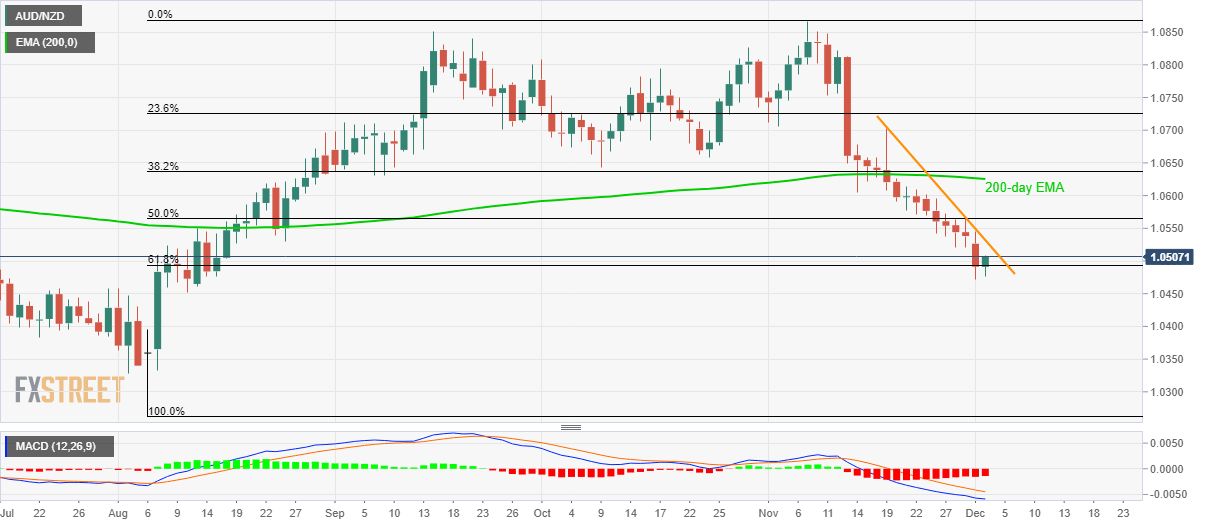
- 200-day EMA acts as the key resistance.
AUD/NZD portrays a pullback from the 16-week low while taking the bids to 1.0500 amid the initial trading session on Tuesday. The recent run-up in prices could be attributed to the Reserve Bank of Australia’s (RBA) inaction.
Read:
Even so, prices stay below a two-week-old falling trend line, at 1.0532 now, a break of which could escalate the recovery towards 50% Fibonacci retracement level of August-November rise, at 1.0565.
However, a 200-day Exponential Moving Average (EMA) near 1.0625 could keep medium-term buyers away from the pair.
Meanwhile, a daily closing below 61.8% Fibonacci retracement level of 1.0493 could recall sellers targeting August 12 low near 1.0450.
During the pair’s further downside under 1.0450, 1.0330 and August month bottom surrounding 1.0260 will be on the Bears’ radar.
AUD/NZD daily chart
Trend: Bearish
