- Symmetrical triangle challenges the moves ahead of important data/events.
- More room on the downside that the otherwise.
Despite taking a U-turn from 1.0540/30 support-zone, AUD/NZD failed to clear immediate resistances line and is taking the rounds near 1.0585 during early Tuesday.
Monthly releases of Australian trade balance and retail sales will become an immediate catalyst to direct moves connecting the Australian Dollar (AUD) while the afterward even concerning monetary policy decision by the Reserve Bank of Australia (RBA) can trigger Aussie volatility.
While looking at the descending trend-line since April 17, at 1.0595, and the 1.0540/30 horizontal-area, a short-term descending triangle pattern comes into the limelight ahead of the data/event.
Should the pair breaks 1.0595 resistance, 1.0610 and 1.0645 can entertain buyers whereas 1.0680, 1.0715 and recent highs surrounding 1.0730 may challenge the bulls then after.
Alternatively, a downside break of 1.0530 can drag the quote to 1.0490 ahead of highlighting 61.8% Fibonacci retracement of its latest upside, near 1.0450.
Moreover, pair’s sustained downturn beneath 1.0450 may recall 1.0400 and 1.0370/65 supports on bear’s minds.
AUD/NZD 4-Hour chart
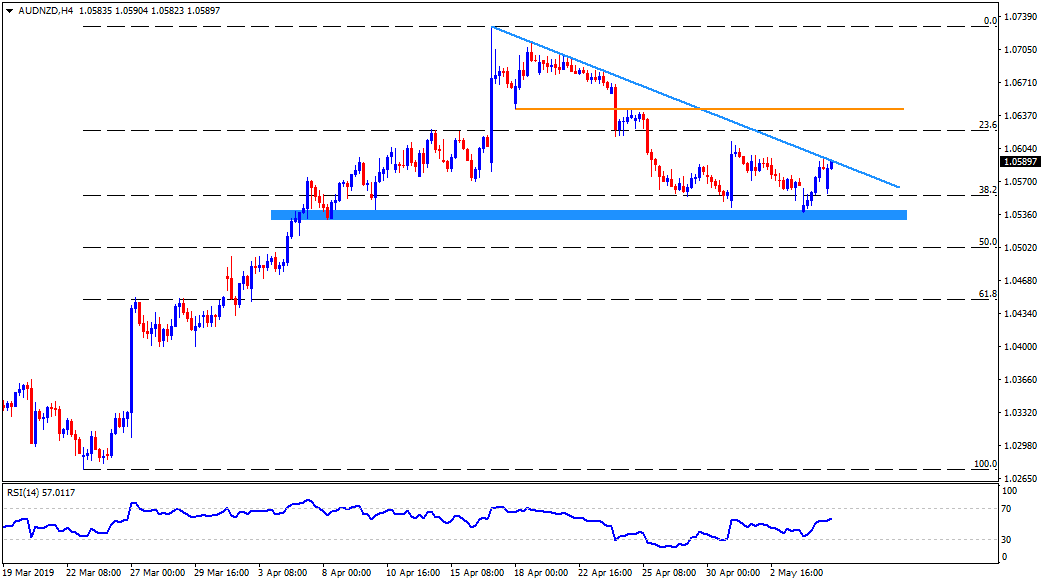
Trend: Sideways
