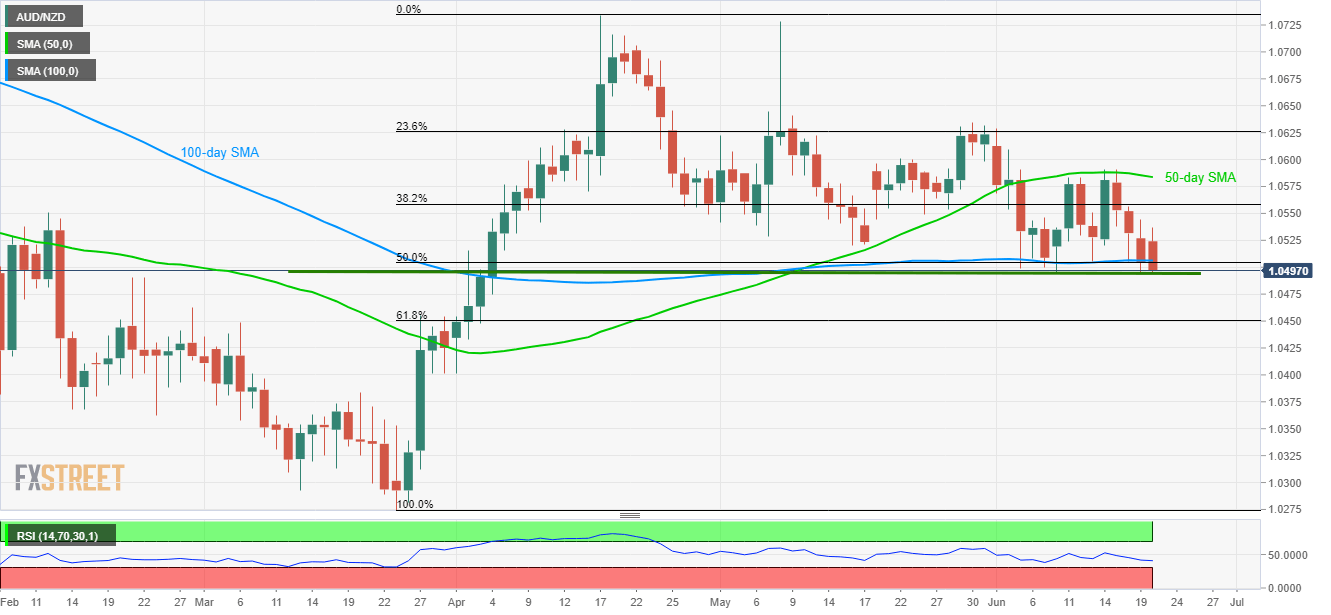
- Buyers keep lurking around recent lows despite Kiwi positive GDP numbers.
- An uptick beyond 100-DMA can trigger short-covering moves.
- 61.8% Fibo. appears next on sellers’ radar past-1.0495.
Even if New Zealand GDP data came in better than expected, the AUD/NZD pair refrains from declining below short-term horizontal-support as it takes the rounds to 1.0497 amid early Thursday’s trading.
New Zealand’s Q1 2019 GDP crossed 2.4% forecast to clock in 2.5% upwardly revised prior while remaining unchanged and meeting wide expectations with 0.6% QoQ figure.
The 1.0500 – 1.0495 support-zone comprising current month low and high of April 03 challenges the pair’s recent downturn, a break of which opens the door for additional declines to 61.8% Fibonacci retracement of March – April upside, at 1.0450.
During the quote’s extended south-run under 1.0450, late-March lows surrounding 1.0400 and 1.0275 could become bears’ favorites.
On the upside, a pullback beyond 100-day simple moving average (SMA) level of 1.0507 can trigger fresh short-covering moves towards 1.0540 and 38.2% Fibonacci retracement near 1.0560.
However, pair’s further increase above 1.0560 will be challenged by 50-day SMA level of 1.0585, if not then bulls can aim for 1.0600 and May-end tops near 1.0635.
AUD/NZD daily chart
Trend: Pullback expected

