The Australian dollar showed some movement at year’s end, dropping close to the parity level before rallying to end the year just shy of the 1.02 level. The upcoming week has four indicator releases. Here is an outlook for the Australian events, and an updated technical analysis for AUD/USD.
The markets may have bid farewell to 2011, but the European debt crisis hasn’t gone anywhere far, and continues to weighs heavily on risk currencies such as the Australian dollar. EUR/USD ended the year 400 pips lower, and if investors continue to flock to the US dollar for safety, the aussie could weaken.
Updates: The Aussie enjoyed optimism from Europe and improved PMIs from China and India to rise above 1.03. New worries from Europe stop the rally and the pair couldn’t cross 1.04 . Australian trade balance now in the limelight. See how to trade this event with AUD/USD. Australia has seen a lower than expected trade balance surplus. Together with German and French issues, the Aussie dropped sharply back to around 1.0250.
AUD/USD graph with support and resistance lines on it. Click to enlarge: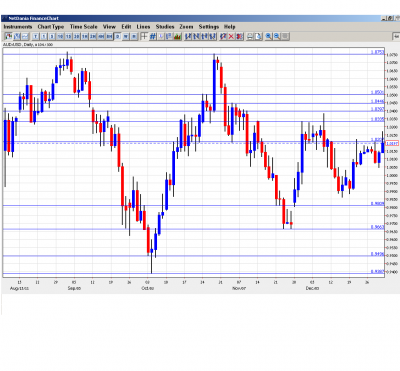
- AIG Manufacturing Index: Monday, 22:30. With only one exception, the index has been under 50 since August 2010. This indicates that the manufacturing sector is in poor shape, and this situation seems set to continue into 2012.
- Commodity Prices: Tuesday, 5:30. Australia’s export sector is very dependent on stable commodity prices, but the indicator has been dropping steadily for 10 straight readings. With a deep global slowdown, this could well continue into 2012.
- AIG Services Index: Wednesday, 22:30. The index has been under 50 for the past two readings, indicating contraction in the services sector. The index recorded its fourth consecutive drop in Decmber, which is certainly a worrying downtrend. Will the index bounce back in the first reading of the new year?
- Trade Balance: Friday, 00:30. Trade balance figures have been down for the past three readings. From an October figure of 3.10B, which was the high of the year, the index has fallen sharply to just 1.68B in December. The forecast for the January reading calls for a further drop, down to 1.60B.
Technical levels from top to bottom:
We begin with the round number of 1.0733, which is strong resistance. Next is the round number of 1.05, which served as support in May and June, and is now in a resistance role. Below is 1.0450, which was tested in November and is a line of strong resistance. This is followed by the round number of 1.04, which is also providing strong resistance. The next line of major resistance is at 1.0336. After serving as an important line of resistance in December, the level of 1.02 looks ready to fall very early in the new year. The pair did drop to 1.0044 this week, but parity has not proven to be much more than a psychological barrier. Next is 0.9890, a weak support line. 0.9810 is now providing strong support to the pair. Strong support for the aussie can be seen at 0.9660, as well as the round number of 0.95, which was breached only once in 2011. The final support level for now is at 0.9376.
I am neutral on AUD/USD
Economic indicators are clearly stronger in the US than in Australia, which would favor the greenback against the Aussie. However, the aussie rose above parity this week, showing renewed strength and climbing all the way past the 1.02 level. Will the aussie rally continue?
Further reading:
- For a broad view of all the week’s major events worldwide, read the USD outlook.
- For EUR/USD, check out the Euro to Dollar forecast.
- For the Japanese yen, read the USD/JPY forecast.
- For GBP/USD (cable), look into the British Pound forecast.
- For the Australian dollar (Aussie), check out the AUD to USD forecast.
- For the New Zealand dollar (kiwi), read the NZD forecast.
- For USD/CAD (loonie), check out the Canadian dollar.
