- AUD/USD could not hold the RBA gains.
- The accommodative policy of RBA helped the Aussie to rise.
- However, the bounce-back of Greenback weighed heavily on the Aussie.
- Fed meeting minutes can provide fresh impetus to the market.
The AUD/USD pair could not hold the post-RBA gains and started falling from 0.7600. The pair reversed all gains and closed the day in negative territory.
What happened in RBA?
In an accompanying statement, the RBA noted that the central bank’s moves will provide continued fiscal support to the economy, as it needs meaningful support in the transition from recovery to growth.
The latest published macroeconomic data, according to the RBA, looks quite strong, but the risks of the uncertainty caused by the pandemic remain too strong to relax. This claim is supported by the facts: strict restrictive measures are now in place in Sydney due to the danger of a wider spread of the virus. Official data show that no more than 9% of the adult population is vaccinated, and this figure is one of the lowest rates among developed countries.
Nevertheless, the AUD reacted positively to the news about the continuation of stimulus – the RBA, apparently, will support the economy until it is fully on its feet.
What’s next for AUD/USD?
The Fed meeting minutes are due today in the NY session. But, first, we have to find the consensus of members on policy tightening in the light of the recent US labor market report.
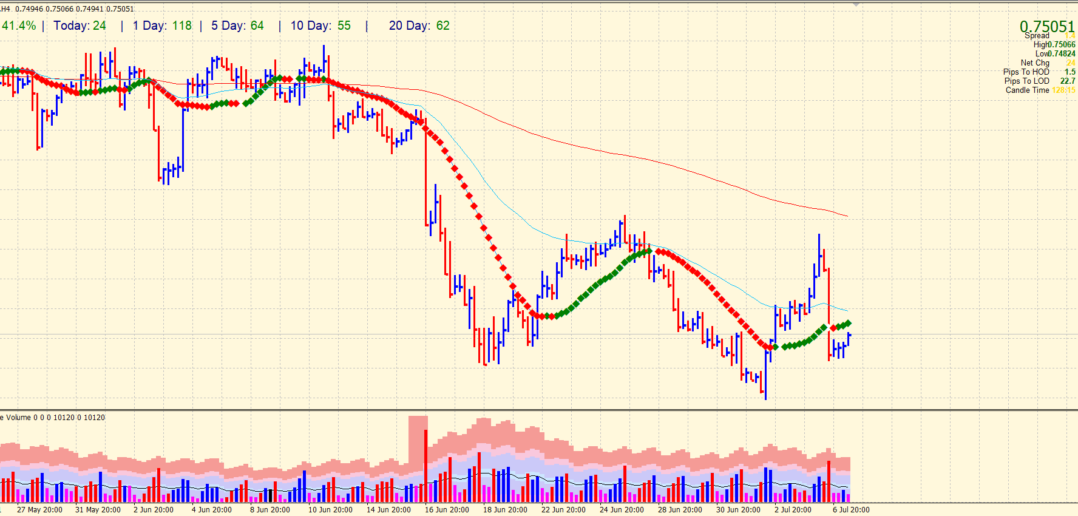
AUD/USD technical outlook: Key levels to watch
The price is trying to push upwards after a huge fall yesterday and close below the 20-period SMA on the 4-hour chart. However, the key is still a 20-period SMA. The pair needs to close above it to retain the bids. The last day fall on US ISM data came up with ultra-high volume followed by very low volume. It means that the sellers are taking profit that may lead the price upside.
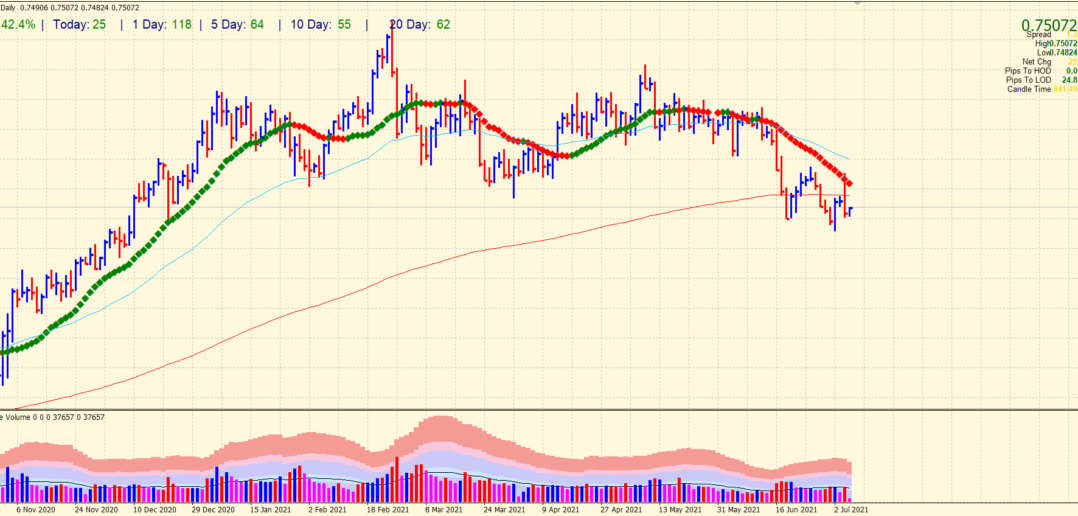
However, the daily chart is still extremely bearish. The price came back below the 200-day SMA with a widespread down bar. Any upside will be potentially capped by the 200-day SMA at 0.7540 area.
Looking to trade forex now? Invest at eToro!
67% of retail investor accounts lose money when trading CFDs with this provider. You should consider whether you can afford to take the high risk of losing your money.
